Welcome new reader!

START HERE, READ THIS FIRST.

Tuesday, March 30, 2021

Leverage - It works in both directions

As you likely heard, hedge fund Archegos could not maintain margin requirements.  The result is their creditors, primarily Credit Suisse and Nomura are expected to lose billions.  The market is still in an epic bull run and stocks are near an all-time high, so what could have possibly forced the banks to do a margin call?   

I suspect the pending expiration of the SLR rule forced banks to return to expected margin requirements for their loans.  This would have forced the banks to request Archegos to become stricter with margin requirements.    The question I have for you is, how many highly leveraged positions if unwound would cut stocks by 50% like Archegos did?  Are there any other positions out there that will have new margin requirements by its lenders after this event or with the SLR rule expiring on the 31st?

This is NOT a moment like 2008 failure of Lehman Brothers, but sometimes history repeats in a similar manner.   To learn more about The Macro market considerations, click here.

I view this event as exposed to what I have been concerned over since January 25th.  Even if we have no market downside, I have a hard time understanding the catalyst for a material upside in this environment.  There is likely now more than ever upside in Bitcoin as younger people will exit market games and go to the 'safe bet'.  This of course won't be safe, but it may provide a counter play to the markets for a bit before that also hits a maximum.  Buying Bitcoin right now is a calculated risk that may pay off very well.

To hear more about why Archegos failure is potentially a systemic risk, watch this video, he does a great job to explain.


Sunday, March 28, 2021

The MACRO market considerations

 I want to understand the macro environment in hopes that any short term investments eventually align with the macro view.  For example, if you purchased Apple at the iPhone announcement, although that day didn't yield epic Apple earnings, the macro view changed and eventually stocks align to this new reality.


So lets take a look at the MACRO environment.


1) When COVID hits, USA alone shed 20 million jobs, and a year later its about 19 million unemployed.  It is going to take 5 to 10 years to get back to employment levels in January 2020.  If you have a good analysis, not flippant opinion, to the contrary PLEASE post in the comments!

2) Due to the reality of #1, the entire US economy is trading off of free money, easy loans, near zero loans, and a falling US dollar.  Part of the free money was the suspension of the SLR rule that is set to expire in March 31st.     This is what rallied the market over the past year.  The question is if these factors change, would you expect the same market acceleration over the past year?

3) Interest rates have been seeing pressure, and odd things have been happening like the REPO market yielding negative interest rates.  

4) As posted in January 24th, the amount of leverage in the stock market is staggering, this is great to advance prices but if things turn it will caused sustained pressure on the downside. An example of a hedge fund failure due to leverage was announced.  This is potentially one of many leveraged accounts.

5) The leading FANG stocks are all off their highs, and have been in a flat-ish trading range for months.  the NASDAQ is materially off it's highs.  I don't think an overall market boom can happen with tech going lower.

6) Insiders are selling is at high levels. On aggregate level the current selling level is what is a normal peak in selling, and has been relatively sustained in 2021. 

There has been large selling by Bill Gates Foundation in Q4 2020,  selling 100% of their UBER stock, 100% of BXP Boston Properties, 100% of Ali Baba, 50% Goog and 50% of Googl, 50% of Amazon, 50% of AAPL, 50% of Liberty LILAC, 10.6% of Berkshire.

Warren Buffet has sold 117 Billion of Apple stock, 3 billion of GM, 58% reduction in Wells Fargo,  sold off last of his JP Morgan,   

Buffet was a buyer into medical ,insurance, and some consumer companies in Q4 2020. buying into Merck, AbbVie,  Kroger,  Marsh & McLennan,  Chevron,  and Verizon.

In my opinion the first 5 items is pause for concern, what the market position in end of January to today, there is no new news expected.  Everyone knew with Biden elected free money is coming.  We are waiting for new taxes and other drags on businesses that have shed 19 million workers.  Its simply on a maco level looking pessimistic.    Until I see NASDAQ hitting new highs, I am a skeptic of going long this market.

Thursday, March 25, 2021

Bank Statutory Liquidity Ratio (SLR)

 This video does an excellent job at explaining the change in the financial system that will occur on March 31st, due to the Federal Reserve has stated they cannot extend the SLR exception put into place 1 year ago.

The important aspect is banks that are a GSIP (Globally Systemically Important Banks) must become compliant to normal GAP accounting.  The SLR rule was suspended for a reason, to enable banks to have more ability to loan money in the downturn.

However, now that the SLR rule is being put back, people are questioning how to do do accounting related to this rule.  Depending what is determined to be the right way to enforce the SLR rule, it could have substantial consequences for bank liquidity.

The theory is the banks will take cash deposits and buy treasuries to improve their balance sheet.  Assuming this is true, it will drive bond rates down, which by the way may help markets appreciate.

Another view is banks refuse to buy treasuries, causing rates to spike hard.

Skip to 36 minutes in to see the potential impacts.


Wednesday, March 24, 2021

Market Update, a bear is stirring

 Just yesterday I called out from previous posts, SPX 3892, and today into the close the S&P raced down below that, closing at 3890.

I added  a new dashed green line, 3722, a close below that CONFIRMS we are in a new pattern, lower lows rather than higher lows.  Again doesn't mean a market collapse, but makes a very strong case for a bear downturn.  I think the market is a buy at 3242.


Here is a long view that I think will happen.  There is two things to change this view, one is the FED announces a new program, or two economic data surprises materially to the upside.  Target is net neutral or a little bit of a loss for 2021.  It is possible we see a huge down, but with free money giving to people, I have a hard time believing we will tank that bad.  The price action of interest rates will be key if the S&P 500 hits 3242 range.


Tuesday, March 23, 2021

Market Update

 So Bitcoin failed on the same day as my last post.  I am not a big buyer right now of Bitcoin.

This past Friday was a huge event, the Federal Reserve bank announced the suspended bank SLR rule will go back into effect March 31st.   This is important, as this affects banks reserve requirements.  So for the last year banks could lend more money and have deposits with higher risk (less reserves).  For the last years banks could make more money by extending credit with less cost.  This party is about to end.

The market rallied to a new high leading up to the SLR announcement, now that it has been made, and the 2 trillion budget passed, there is not any free money news.  In effect the market has priced in everything we now have, and the SLR rule being re-instated maybe viewed as 'new news'.

First a large view of S&P 500.  The dark green rising line represents an uptrend since March 2020.  If the market breaks through it, it is an indicator that we are changing a pattern.  This happened in February 2021, but since the market recovered I adjusted the line to include that downturn in the 'uptrend' line.

So now lets pull into March 4th to today.  We can see that uptrend line touching on March 4th, and the market is re-approaching the 3892 level, the red dashed line.  If we hit that line on a closing basis its looking more bearish.  When is it time to panic? a close below 3693, the second red line.  We will have closed below the last low on March 4th and the low on January 29th.  It would indicate we are likely seeing a failing market.

 Interest rates are falling, and until this past Friday that indicated a market rally.  Now with interest rates falling, market is falling, that is also a change.  I expect if we have a market correction we can look back and know that rates fell as big money moved into bonds ahead of the public, to preserve their capital.  Its important, on a market failure, you do not try to catch falling knives, it is no secret the market is over-valued and over-leveraged.   My target for a downside is SPX 3000, which is a little over 20% lower from here.  We could go lower, but I suspect the FED would come to the rescue.

Good luck!


Monday, March 22, 2021

Bitcoin looking good

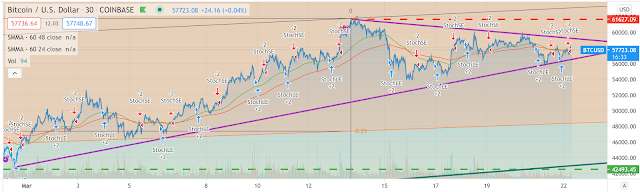
 I think Bitcoin is looking good, there is a range that the price action has created since Feb 28th.

A break out up is bullish, down bearish.  We are getting close to decision time.

Chart below shows the low on Feb 28th to today.


Saturday, March 20, 2021

Don't invest in the old companies

I have lived my entire life in the 'wake' of the baby boomers. Unfortunately for me, the entire economy will flip in favor of the boomers to the millinials and younger, skipping over Generation X. Companies, like Exxon (old industry), Oracle (old tech), are not a good bet on the future. For example, we have seen peak demand for gas in 2019 in our lifetime. Electric cars or hybrids are here to stay. The costs make it cheaper than a normal gas car. In 2020 Exxon wrote down 20 billion dollars, and slashing spending to lowest level in 15 years.  In November 2020, analysts say that Exxon requires to increase debt by 8 billion to pay dividends in 2021.

The combination of looking at future growth, combined with current expectations required to be a favorable stock (dividends) makes Exxon a low probability of successful valuations.

The last year has been one of buying on emotion, not value, and Exxon is one of these stocks.
But lets assume I am wrong, as you always should do.  What else can we do to confirm my theory?
One way is to use price charts, look for a key level that will indicate the stock is declining and is likely to have additional declines.

Below are two charts, first is the MACRO view, why certain price points have meeting from a historic view.  The second chart is the close up view of the near-term price action price points to watch.


Above shows clearly there is good support for Exxon stock at about $31 dollars, if the stock falls to this level it is more likely to rebound than fail.  However if it breaks down to $29 for more than 1 day, I would expect the stock to move to 10-15 over time rather than 45.   Meaning it is more likely to  lose 50% of value than gain 50% in value.

Conversely the price Exxon is at right now is at the level of being bullish.  If it can break above this level for a few days and hold it, I'd expect it to rise to the purple line.  The purple line would be the next test for being bullish to make a run to new highs.

Lastly, the purple lines represent a 'channel', and this is the price area it is expected to trade in. 


Bottom line, a break DOWN below the first green dashed line should be a signal to sell ASAP, a break below the purple line is also of great concern as it shows accelerating price decline than history has shown.

A break above the upper purple line is quite bullish, and a new high is potentially ahead.


So there you have it, two ways to look at Exxon stock, future prospects, less gas purchases, debt spending to pay dividends.  Exxon used to give dividends out due to great profits over its 135 years, now it gives dividends by borrowing money.  Its not a net cash company, something has changed, my guess is gas is becoming less profitable.

The other way is to ignore the big picture and look at price, and know what is good and bad for Exxon.  This logic can be applied to any long term buy and hold, especially for older companies.

In general, look forward for growth sectors to invest in, not sectors that are shrinking.  At least the MACRO view will help increase likelihood of success.

Good luck!

One final look at Exxon, in the past week.
Exxon did BREAK above the red line for 20 days, Monday we will see if it can bounce off the red line.  If it does that is bullish, next move to purple line.  If breaks down, its a failure and I expect further declines.  Notice the two moving averages (red/green lines) the red line is above the green, that indicates more down to come.


Sunday, March 14, 2021

How to Maximize Investing Profits

There are many investment vehicles such as stocks, bonds, real estate, and scarce resources.
Scare resources are gold, silver, or now cryptos (Bitcoin).

The short answer on how to maximize in investing.

Step 1  - The bottom (buy low)
Buy Bitcoin (prior to 2020 buy Gold miners) at the bottom of the stock market 
On the snap back (like bitcoin going from 5K to 10K or GDX going from 16 to 45) and sell. (100-300%)
Step 2  - Diversify into stocks
Buy stocks with the quick snap profits.
Step 3  - When rates rise buy bonds
Ride the stocks to a toppish area, and start to take profits and put it into bonds once you see interest rates rising.  Rising rates will be the catalyst for the feedback that the risk is getting too high.
Step 4  - Market decline
On a market decline, enjoy your bond holdings.
With an extreme bond profit (20-40%) sell bonds and go step 1.

I know life isn't as simple as above, but each of the assets have a purpose, when and what to invest in.  

Due to this new view, I am going to go to almost no gold stocks.  It seems quite insane as I always had some.  But with Bitcoin as the new gold, I am having a harder time than ever on gold.  I recognize that this may be the exact bottom in gold and this post will be an epic joke that follows me.  

I believe we are in step 3, and I will change investments accordingly.

As for bitcoin, there is a really good discussion on why in the downturn bitcoin will likely get hurt.

Below is the full video, a great discussion.


Friday, March 12, 2021

The Party Pooper

There is always a Party Pooper, and for the market, its interest rates.  The market believes with free money from Democrats we will have inflation.  I agree free money will inflate some prices, and depress others, as any government intervention does.  

The market 'shows' this expectation by raising interest rates required for someone to 'risk' buying US federal bonds.  If the interest rates rising ever gets away from the FED, that would spell draconian reactions by the US government and the FED.  The US society is built on debt, and rolling that debt forward rather than paying it down.  It can't tolerate interest rates that rise too much.

But what is too much?  If you find a great whitepaper that can calculate the exact 'too much' please share in the comments!  For now, best I can do is look at what is relative to our near past.  The chart below is US bond values, and the lower the value the higher the interest rates.  Bond values have an inverse relationship to rising interest rates.  To learn more, watch this.

I drew a red line that caused markets to fall a couple of weeks ago creating a panic.  Overnight rates spiked below that line and markets are poised to open lower.  Yesterday the Nasdaq failed to come close to new highs, the S&P 500 failed to close at a new high.  Bitcoin failed to make new highs.  The VIX spiked (volatility).  So the market is NOT in a confirmed bull mode.

Interest rates ARE the story! Without rates complying, the market will not advance.  One way to make them comply is to simply go Zimbabwe and the Fed announce they will buy infinite bonds to keep rates low.  If you don't know why that's bad, read about Zimbabwe currency.  So I highly doubt the fed will do this unless there is a market crisis beyond 2008.

Today with this confirmed market weakness, and seeing how badly the market reacts to interest rates, I will not flip to bull mode until I see the Nasdaq, the S&P 500, bitcoin all make new highs and either rates falling OR the dollar dropping.  That was what we had over the last year with this bull, easy money.

To the charts! Interest rates overnight broke the red line I drew going back to July 2019.  The second chart is a close up of last nights action, talk about a big money setup!


Closer look


Recent interest rate and NASDAQ action  since NASDAQ high.


Tuesday, March 9, 2021

Interesting Chart Today

I have been leaning more heavily on charting recently, as I believe we maybe at a top.  It is also possible this is just a pullback with a market ready to explode higher.

To try to navigate the emotions "buy it all" and "sell it all", I am trying to use charting to help.

Its partially helpful.

But today I want to share with you a chart that has emerged, it is quite insane on how that charting demonstrated the market hitting chart resistance.

I bring you two charts of the S&P 500, the first is back to March of last year to today.

Notice the red line in the upper right hand corner trending down.  I drew that line a week or so ago using price action to show the resistance since Feb 12th.  The second chart, shows TODAYS price action and I did NOT touch the red line, it showed the actual resistance the chart showed.

In the days ahead if we can break through on a CLOSING basis above the red line is bullish.  And if we can go above Feb 12th high, we will be in a full all out bull market.

For now, appreciate todays price action, and how the market hit a 'glass ceiling' giving way on the close.  The magic SPX number I have stated to friends is 3897, and yes, we closed below it.

I put my shorts back on, and I am prepared for a rejection, but quick to end my shorts if we close above that red line. My bear market will be confirmed somewhat with a close below SPX 3721, first level of support is 3693.  I think there is a good chance we will finally get a counter rally there.  This may then fail, with a target of 3250.  If we hit that, I will need to reassess the bottom target.


The last 5 days price action, quite amazing today!


Sunday, March 7, 2021

The Bull is back?

Stock Market

Friday was a POWERFUL reversal, it looks like it could be a short term low with the bull returning.

However, as per my new focus on charting, what the chart say?

The downtrend hasn't been broken yet, and the bull hasn't yet been fully killed either.
For the BEAR case, what I can say is, the uptrend from  March 23, 2020 til March 2nd 2021 has been breached.  This doesn't mean a bear market is here, but it does mean caution.  Avoid leverage in either direction.

In my opinion a market close above 3864 is bullish, and a close above 3892 even more so. A TRUE bull is on if we make new highs, set Feb 12th at ~3950 only  3 weeks ago.

Each step I get more bullish and a new high, there is zero disputing the bear will be dead.

But how do we know the bear has won? a Break BELOW 3690 on a market close is pretty bad, it will solidify a new lower low.  If we do, the target I have for a potential near term bottom is about 3250.


Bitcoin

I have to admit, bitcoin is looking quite good, excellent really.  It has NOT broken a major uptrend.  It isn't in full bull mode either.  A full bull is new highs, and bullish is staying above 53180 for a day.  I say for a day since Bitcoin has no close.  A bear for bitcoin is any sustained (not for a 15 minutes) breaking below 39000.  On the downside levels are 42K, 38K, 30K(ish) then 22j.
Overall there is really nothing to not love about bitcoin.

There are two risks I see for bitcoin, one an overall stock market decline.  We haven't yet seen bitcoin be able to buck a market decline.  And until we can witness this, my assumption is if the market declines so will bitcoin.

The second one is some sort of Federal Reserve Announcement issuing their own crypto currency.  In the scheme of life this isn't a big deal, as, US dollars is already electronic.  Shifting to a crypto dollar is spectacular for financial institutions to reduce costs.  But it isn't a substitution for a deflationary collectable. (bitcoin).

Bottom line is a hard day below 39k, I'd be pretty worried.  Until then , bitcoin will gain and lose  up to 25% is normal.

I don't want to minimize the risks here, but so far, I can't say it is a must sell.


Gold


Just stay away from Gold, it may have bottomed, but if the bull is back in the market, gold will get absolutely killed.  Care is warranted.  With that said, gold is right now at a major support level.  If this fails we are talking losing 15% before the next level.  If the market takes off I expect energy to go nuts, and that's bad for Gold profits.  Frankly, I am starting to really hate gold.


Bonds


I expect rates may continue to rise.  Owning bonds is a near term loser.....until its not.  At some point interest rates will hit something terrifying and the government will need to choose stocks or bonds to rescue but not both.  That could be a week or a year away. I own some bonds to learn with the pain.

Wednesday, March 3, 2021

Buying Bonds

 Although I have traded since 1999, and owned stocks for over 30 years, today I bought in bulk Federal Bonds, specifically 7 year and longer dated 20 year bonds.

Why?  If the market falls, I expect people flooding to bonds for protection.  Yields should plummet to potentially negative territory.   I will sell these bonds if this happens.

Federal bonds yield 10x leverage, so you can buy 400K federal bonds with as little as 40k!The result will be if I am right, there is a multiplier effect that will happen.

I sold off all my extra crypto, reduced my gold miner positions, leveraged up my short positions.
I may sell the rest of my positions and buy more bonds and go into cash.

After hours the S&P 500 broke to the DOWNSIDE.  Although it isn't official a bear until we break a bit lower.

A break below 3787 is really bad for the S&P 500.  A close below that I believe we have begun a multi month, if not multi-year bear.  All assets will go down EXCEPT bonds, which should appreciate as people run to bonds.


Good luck!


Some chart analysis 

Boom or Bust?

 I watch and read quite a few financial sources, and at hand is the argument is boom or bust.  Almost universally it is agreed this ends with a bust, but is that very soon or a year out?

Most of the boom argument is about the free money about to be unleashed onto Americans by the democrats.  The argument goes last years free money produced the market boom in 2020, so its time to repeat it in 2021.  Its a good argument. 

The Federal Reserve wants to keep this party going too, with their recent change to no longer include new money in savings accounts as money expansion.  See Federal Reserve Changing Reporting on M2 Money .  And last night Bitcoin is trying very hard to enter bull territory.

The Green line represents the long term trend line for bitcoin, and it just crossed above it.  For me to believe this rally I need to see bitcoin 53,200, and of course once it crosses the previous high we are back into full bull. I even added A LITTLE of bitcoin on Monday on the open.

So what's the problem ? (Scroll down)


The problem I have is free money for everyone in the next 3-6 months is everyone's play.   But being a skeptic isn't evidence or a reason.    There is only two 'masters' of the markets that can take it down, value of USD and bond yields.    Too much free money could bring the USD into new lows and the US could lose control of the dollar.  Bond rates could rise until triggering a market run to force the rates down in a panic run.    Gamestop had a short against it of 135%.  US treasuries have a short against it of 200%.   What would happen if the shorts got scared?  We got a taste of a small scare among the shorts last week with rates rising in the 7 year, and the market corrected.  Mortgage rates are very low, but could that change also?  The rates are stabilizing, but is that it for the year ahead?

With a full bond short panic we would see yields on the secondary market go negative.  That right, people paying 1, 3, and maybe even 5 year a negative return to own a US treasury.  

So other than USD breaking down, or bond market short squeeze, I agree the markets are set to double from here with all the free money, and Bitcoin to go to 200K with ease.

Watch TLT on your favorite chart.  Below is a 7-10 year treasury graph.  Fun fact, over 50% of US treasuries in the 7-10 year changed hands last week.  That means there was a buyer as others sold.  Is those buyers stupid or expecting a return?  Look at the two LARGE volume candles, one red, one green, all being bought.


Since we are in a market the FED tries to control, its hard to say what the market does AND what the FED does.  To learn more about this bond theory, listen to 'the bond king'.


Another analyst who doesn't see the bond squeeze ahead, runs with the free money run, but see's a housing bust if it does.

Tuesday, March 2, 2021

Federal Reserve Changing reporting on M2 Money

The money supply is actively watched by economists to try to understand the impact of 'too much money' being injected into the system. One of these money supply metrics is called M2, and goes back to 1980 on the Federal Reserve Bank. The change is to no longer count 'savings accounts' as part of the money supply. History will tell us if this wasa mistake and ends up under reporting money supply. The timing is interesting, as the government is about to give large amounts of money to the public, deposited to people's savings accounts. Below is an image I took of the Fed site today, 3/2/2021, you can see it here: The new M2 without season adjustment is here, and seasonally here.

Saturday, February 27, 2021

MUST watch videos

I watch quite a few videos, George Gammon does a great job of breaking down financial forces and keeps it entertaining.   I recommend watching all the videos he has on this list here:  

This video explains the situation America is in, it should start at 18:00.  IF it doesn't skip to that time.


This video does an EXCELLENT view of the forward next 3-10 years.  I don't agree with all conclusions for market valuation targets, as people will react.


The Central Banks will try to capitalize on the crypto revolution and put out their own.  Bitcoin valuations will take a massive hit, but from the ashes I think Bitcoin as a value store will prevail.


Friday, February 26, 2021

Market Cracking on target

 Finally, FINALLY the markets are going to revert back to true value.  As I posted in December "Resuming the March decline Ahead" on December 2nd, I gave at most 3 months until the last bull blowoff ends when I emailed friends.  We are close to the 3 month mark, and the downturn has finally started.

Over the last year we have kept the bull running, but I FINALLY think the top is in for a while, potentially years.  Why? Because as I posted in "Resuming the March Decline Ahead"  President Trump pressed every last easy button  to get "the worlds strongest economy" in January 2020 with a 1 trillion a year deficit.   There is no easy road ahead, which will not play well with stocks.

The bond market is losing control, now the FED and the US government has to convince the world we won't continue the reckless finance.   Its going to be a hard cell.

How do I know I am wrong? Its simple, if the S&P 500 closes a mere 4% higher then I am wrong.  We need a closing print above 3,951.  If I send this to you, I recommend you dump it all, and on a closing print for a solid week (to avoid a fake new bull), and buy back.  If not cash is best.  Since bonds rates have gone up, you can buy bonds ASAP and hold watching your bonds rise in value as the bond market reverses.

So how far does this market fall?  It of course, like everything in life depends on the actions of countries and institutions.  However using history as a guide, and all easy buttons pressed,  I think a 50% cut is in our future in the years ahead before a final bottom.  Some of the Hedge fund manager I respect target as much as 80%.  Although this should happen, I don't think it will.  The governments and the FED will do anything to stop that from happening.

Given what I said above, calculate 33% loss as the target.  Why? As I posted on January 25th "I am tapping out", the leverage using loans to buy equities is at materially higher all time highs.  Quite a bit of this leverage is being used by Millennials who have not experienced a bear market.   Many will get squeezed out with margin calls with forced losses, and this will cause a cascade problem.

I am not convinced another 2008 crash is in the cards, but I do think a trend change of new lower lowers in the year ahead is here.  One of the reasons NOT for a 2008 crash is the new free money the Democrats will give to people.  Many will gamble in the market, and the best way to take that money is to have a long drawn out loss.

I think there will be many reversals in the months ahead, as most will think we are going to resume a bull.

So for short term trading, you can buy into the markets at S&P 500 of:

3700 - around the previous dip level.

3600 - around first Fibonacci level, 
3300 - strong resistance due to past market action.

After that its pretty murky, next major level is March 2020 level of 2200.  I'd expect a minimum bottom around 1900.  We would need a capitulation moment, and going lower than March 2020 would do it.

What about Bitcoin? Unfortunately I think it cannot escape the deflationary downturn.  The exception could be once again , the Millennials.  At some point, they will give up on the market (SPX 22000 break?) and just buy Bitcoin in disgust for a buy and hold.


Since Bitcoin is a pure wildcard, its harder to say how low it may go.  I am looking for a low of 22,000, maybe piercing 20,000 in a day.  Thats my level to rebuy.

What tells me I am wrong? A new bitcoin high for more than 1 full day.  I will start to get optimistic at Bitcoin over a day at 53K.

When this market route ends, I will be looking to buy into India, Bitcoin, some gold miners, global index funds, emerging market funds, and a little bit of a US ETF (TBD which).

The markets may resume the rally, but we are close to a terminating end with the borrowing and debt.

Good luck!


If you want to learn more, learn about the bond market, although its not in favor, it drives everything in USA as a debtor nation.  Here is a good video:

https://youtu.be/fNwd-UuE3Dg


BitCoin Charts

 Chart of last 6 months, notice once Bitcoin broke the first red trend line on Feb 22nd, it went down quickly.


Zooming in since Jan 22nd, when I went suddenly bearish in post "I am tapping out", we can see over night it violated 46k briefly over night. (orange into green area)  we also broke slightly lower than the Feb 23rd low.  If we go through the 45K then next target is 42k-38K for support.  If we violate 38k, then we can return to 32K, from Jan 22nd.

A material print above 53K starts to turn me bullish, and a new high is obviously bullish.

When investing, think, when can the big money make more money from the small guy?  When the small guy is piled up onto the same side of a trade.

Dont get trapped, but also if we bottom, also get brave.  My target is 26-22K, but at 29K I may start to add or if we go above 53K.   The stock market is weak, and I expect to go much lower, all assets usually get pulled with it.


Tuesday, February 23, 2021

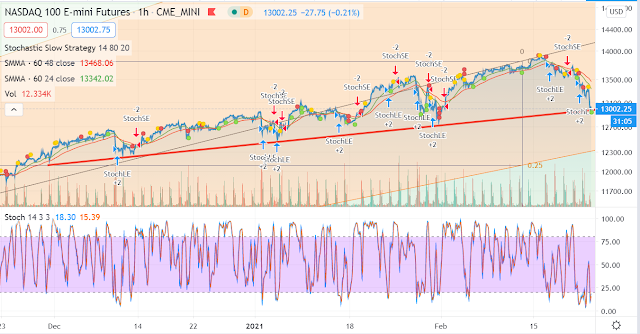
NASDAQ at a critical level

 I am very unsure if the top is in, once democrats give free money to 'everyone', my concern is that free money makes it way to gambling in the market.


With that said, it could also be the good news was built in, so the markets will fall as the 'free money' enters, meaning, they catch the downside. 

In any event, today the NASDAQ is at a critical level, on a market CLOSING basis.  Breaking intra-day doesnt count.

The support line below dates back to Biden getting elected.

Downside of a market pullback is 10-30% before a counter rally ensues.  We could very well bounce today and kick this to a future retest.


Tuesday, February 9, 2021

Parabolic blow off?

 It looks like we may be entering into a historic parabolic blowoff.  The stock market indexes made new highs, and the futures look promising for more advancement.

Therefore it is likely we will continue to see various parabolic gains on a variety of fronts.

I am going to put my $ into these items and yes, I am going nervously bullish.
But the charts don't lie, we are going up, until it doesn't.

if DJI breaks below 30,000 or SPX breaks below 3890 on a closing basis, that raises alarms that all bets are off.
The overall market is not yet in solid 100% bull mode, but its pretty close to it.

Areas I'll deploy in are:
GBTC - I have a bit already, not sure if I'll add from here.
ETHE - Ethereum I won't go in as heavy as bitcoin, it promises higher % return in the short term.

AGC (2x etf at 52) or SLV (at 25) - Silver buying continues at a record pace, inventories are expected to be exhausted soon.  if there is continued buying, the silver shorts are notorious, and we may have another GameStop situation here.
Silver is at 30, and 45 is the all time high, i have to believe a 50% gain is in the future.
MJ - the sector is hot, individual stocks will do better, but I can't afford to get cut in half overnight.

If I want to go short, the ETF of choice for me is DOG, simply because the loss over time is much lower than other options.

I am not buying more GDX/GDXJ, GOLD, but not going to zero either,   Bitcoin is the new gold, I am only doing silver due to the heavy purchasing.

I am going to minimize picking individual stocks, simply because when this cracks, a random stock could get cut in half over night.
The ETF's will have a milder hit.

If this parabolic blow off gains steam this all ends very badly, but its all a game of chicken now.
Good luck!!

Saturday, January 30, 2021

Bitcoin and the Stock Market

I been saying for a bit, the top is around end of January since my post Dec 2nd 'Resuming the March Decline ahead'. 

 Quote ", I expect between now and February the market to decline materially from the high (unlikely the day I am writing this is the high, but who knows!)  The setup for next year is not good.  The market will need to lose 40-60% of its valuation to be a good buy once again, and will likely take years to play out and fully recover. (a decade? 30 years like Japan?) 

This is excluding the print our way out option as I expect Republicans to enforce fiscal discipline much more than they did with in 2016-2020 during 'good times'.  With a crippled economy they will double down the pain in hopes of winning elections.  The easy money train will end in January, unless Democrats takes the senate in Georgia."

So we have a Democratic leadership, free money for everyone.  As long as the free money flows,  I do think the market downturn will NOT be a decade.  It maybe as quick as a few weeks to a year.  Free money to the people will flow, heavily, to gambling, ala Gamestop style or the market in general.  It will also flow heavily to Bitcoin.

That doesn't mean we wont see a punch in the face, as I stated in "Preparing for a GBTC punch in the face" on January 7th.  GBTC hit 48 on January 8th and hasn't come close to that since.
I am hoping that GBTC hits 22, if it does, I may allocate as much as 50% to GBTC.   The other half will be divided 25% Gold Miners and 25% INDA.   India doesn't have any Fed debt trap, and they have 1.2 billion people.  I think looking ahead this will be the decade of India.

So the week ahead will validate there is a downturn, of weeks or a year (I am not THAT good to know exactly how long!).  But once we bottom, I really do think the market will never look back.  We will see inflation go right to the market, and it will be a rocket that never stops.  But that depends on US pumping free money AND the rest of the world doing things like it. 

If the rest of the world doesn't enter the debt race to keep up with the USA, we will have constraints.  Specifically, the USD will be in danger of losing credibility in the world with new lows in value.   The USD dropped 10% last year and was solely responsible for the rally.  Not Trump, not a real comeback, just free money that devalued the USD.  To learn more see my post January 2nd 'waiting for a new market high".  

The USD bottomed January the 6th, the same time I called Bitcoin top.   This is VERY interesting,  or coincidence, its something to watch for ahead.  And the USD jumped Wednesday , the day of the market downturn, again coincidence? I don't think so.

Lastly, we have a new problem in America, first was S&L debt (90's) , then housing market debt (2008), now stock margin debt.  Each time we blow a debt bubble it must unwind once we reach peak debt.  The question really is was last week peak margin debt? Whenever it is, that is the true top.  And the unwind will be ugly.  

Check out "I am tapping out" from Jan 25th to learn more about how extreme margin debt is.

Everything I posted is just educated guesses, so we will see in the weeks ahead if this is a downturn, and how long and how deep.  At some point Trillions more will be released and we should see markets fly until the USD collapses or we show restraint.   Hence Bitcoin, Gold, and India will be my next multi-year play.

Monday, January 25, 2021

I am tapping out

 The market may keep soaring, but it can do it without me.  I tapped out 1/25/21.  I am net short the market now.  Margin is the ability for a trader/investor to buy more stock than the money they own.  Its a great multiplier for profits going your way, and a terrible multiplier for markets going against you.


I have one picture below, full article by clicking here:


Sunday, January 24, 2021

The Pending Market Crash up

 The US has become delusional on monetary policy, and there will be consequences.
We now have a political environment of infinite money, and a new Treasury Secretary Janet Yellen formerly Federal Reserve Bank.    What is happening in the last year is a new union between the US Treasury and The Federal Reserve Bank.  The government prints infinite money, and the Fed buys it to artificially suppress interest rates.  Back in 2009 I called it the bond wall, but since then the government figured a way out of the problem I called out, just have the Fed give itself money and buy the bonds!

With this trick firmly in hand, we have also had the Fed buy assets from banks, resulting in the Fed owning 1/3rd of all mortgages!  Next up is market indexes and corporate debt.  All of this results in a market infinitely moving up with no downside risk.  To solidify this reality we will need a market crack to motivate a bazooka larger than 2020 to be fired to ensure a market rocket.

The question is, do we have conditions for the market rocket now, or must the market crack first to release a new volley.  Only time will tell.

In any event, my obsession with crypto currencies, foreign investments (INDA), and gold miners is in preparation for this future event.

I encourage you to watch these videos to understand in detail my concern.  If you disagree with the conclusion, I urge you to stop reading or following my stock chatter, for my entire perspective is skewed by this view.

Saturday, January 23, 2021

Charts for Bitcoin, Ethereum, SPX500, Nasdaq, IBB, Inda, GDX, Gold, and SPX500

Today we have post of charts!  I created a video with a summary of this post , watch here.

I have a bunch of charts below, all with my own view, I am not a professional trader or financial advisor.
This is just a way to share what I am looking at with those who ask me 'what are you looking at'?

Bitcoin / GTBC - Its the new digital gold, to learn more about excitement in crypto read article on Defi .  I want to buy and sell GBTC based on bitcoin action, and also to sell GBTC when the premium is high and buy when the premium is negative or very low.

S&P 500 / Nasdaq - Stock market indexes that represent USA stocks and technology.
IBB - Index for Biotech, a growth sector in the decade ahead.
INDA - I am a huge fan of India growth in the 20 years ahead, perfect for my retirement account.
           - It is also a play outside of USD valuation.

Gold/GDX - Gold and gold miners, I am bullish only due to the money printing in 2020, Europe changing gold reserve requirements for European banks, plus India will be buying more gold.

updated Ethereum 1/24/21

Asset                           SMA reading                Level to watch                              4 year reading

Bitcoin                         negative                       Stop loss 29K, buy 35k+               very positive
Ethereum                     positive                    Stop loss 1280,                                negative (for value)
S&P500 / Nasdaq        Positive                        SPX stop loss 3150                        negative 20%+
IBB                              Positive                        Stop-loss at 129                               neutral
INDA                            positive                        Stop loss at 36                                very positive
Gold (barrick)              low negative                  Stop loss at 21                                positive, 40+
GDX                            low negative                  Stop loss at 33                                positive, 80+ 

Bitcoin

Bitcoin over the 4 years ahead I believe will hit 100K, and may hit up to 1 million a coin in the decade ahead.  However, my opinion isn't a certainty, but in my head its likely.  Perspectives can change with new information.  Bitcoin this past week  had news of a 'flaw' called double spend.  it was not true.  Janet Yellen made comments about regulating bitcoin.  this is actually a plus providing the US Government doesn't view bitcoin as a threat to itself.  Better regulation equals higher trust, equals higher investment.  

Since it is a great long term buy, the first area is short-term view for direction.  

Bitcoin punching below 28974 is of a concern, next levels of support are 26,000 and 21,000.

We need bitcoin to go above 35000 to get optimistic, and above 40k to aim for moving to new highs.

For this reason, I put sell orders for most of my bitcoin in at 34500, if I had did this charting yesterday I'd probably had my sell in at 33k.  This chart does not look good, I may sell my GBTC on Monday and wait for Bitcoin to have the 24/48 hour SMA cross in a positive trend before buying again.


Examples of buy/sell if using 24/48 hour SMA, I want to start using it for buying GBTC.
I'll be late in, and late out, but the trades are favorable.


Ethereum

Why?   Ethereum is the basis for all the DeFi innovation that got me into crypto in 2020, to read more, click here.   I am not convinced Ethereum will go to 10K or higher.  Its purpose isn't a value store, but to enable financial automation.  I believe the destiny of Ethereum in some future revision to sell an Ethereum token for a price, when the contract is executed, the coin is burned.  This will enable users to pay upfront for 'gas cost' at a known price.  It is the ONLY way to enable Ethereum to take over global finance.  In the near term, the attention to Ethereum is causing price variance.

One opensource effort to fix this 'gas cost' can be found here.  To see how pervasive this problem is, check out this open insurance project switching to xDai.  This is unsustainable, and therefore I am not a believer in Ethereum as a value proposition over the 5 year horizon.  Ethereum is controlled by a non-profit trying to maximize its utility value, therefore high Ethereum prices and unpredictable gas costs are not wanted by those who control it.  There is no limit to Ethereum coins, unlike bitcoin.  They could issue 5x more coins per month starting tomorrow if they wanted.

Now, to the charts! Below is a pulled back view of a Fibonacci fan since late 2020, and then a close up of recent price action.

Summary:  When the 48 hour SMA crosses above the 24 hour SMA, Ethereum is a buy and hold until it flips.  It has been a very good indicator. As of this chart, it is still in a down trend.  (1/23 @10 am est)

Crossing above 1320 indicates a target of 1500 for Ethereum.   Crossing below 1080 will likely bring a target of 880.   Right now the key line is about its current value , ~1200.  It need to push up to  have the 48/24 hour SMA cross or risk another downturn to test 1080. My gut says more pain before it gets better. I put a stop loss in at 1210-1200 to sell 5 of my 7 Ethereum.  Two Ethereum is at a sell limit of 1490. 


Update 1/24/21


S&P 500

I use the S&P 500 because it better represents a wide array of stocks, not just the top 30 like the DOW.

We are in an upswing that started in November, and it remains intact.  The last few downturns have been short and 5-10 %.  The downturn in Feb was more extreme.

Until the indicator crosses, the market is smooth sailing ahead.  I am concerned with the new administration actual real facts must be stated and 'hard choices' articulated to clean up the economic disaster of the last 4 years.

Critical levels: 

Below 3200-3100 range is bad, next stops are 2700 and 2200.

Outlook: Mixed leaning negative.

Upside is infinite , however using historic measures for the market, the ROI should be -2% over the next 10 years.  I expect the new Treasury Secretary, Janet Yellin, who headed the Federal Reserve Bank under Obama, is going to mix things up a bit.  She is a strong proponent of helping the bottom 90%, and she must realize the trillions of free money to the top 1% has exasperated the financial divide.  I expect instead of advocating trillions more to the top, she will advocate 'free money' to the people via government handouts and work in concert with the Fed to minimize the negative distortions.  The question is, were will the free money flow to (aside from basic living costs)?  It maybe the stock market, cryptos, people actually paying down their debt, or a mix of all of these things.   If the top 1% doesn't get their free handout, we will see if the market suffers.


Just to put the S&P 500 into historical perspective.


NASDAQ

I decided to add the NASDAQ index since US based economic growth maybe better represented by this index than S&P 500, since it is comprised of newer technology based companies.

What an explosion since 2016!  View for NASDAQ is similar to S&P 500, except there are core companies that are very well positioned for growth ahead.  I would like to think the downside is a lower risk.

Critical Levels

10900, 6880-6000,  then 4185.  At this point 4185 would be an economic destruction, so I have to even list it.  But it is the high of the 2000 bubble and now its a floor.


To bring context to the chart above, below is NASDAQ movement since 2000.


IBB
Biotech has been huge over the last decade and it should continue to extend as new processes continue to improve to develop better products.   Right now the IBB ETF is positive, with levels to watch are 129 with good support between 85-96.  


INDA

I am a huge fan of the prospects of India.  They are the worlds largest democracy, with a population 4 times larger than America.  It is also a good play to diversify outside of USA and produces income. (unlike gold/Bitcoin).  

Stop loss levels are 36, 32, and 24.


GOLD - Barrick Gold

I am tracking Barrick gold separate from GDX simply because it is a company that has been getting positive press.  Warren Buffet who famously never buys gold miners, recently bought their shares.

This is at a good spot, not great for a buy.  Its at 23.4, and we have a stop loss level at 21.80, with additional levels at 20 then 15.  On this chart I added stochastics, and indicator for overbought or oversold.  GOLD is in oversold territory.


GDX

GDX is an ETF of gold miners.  The reasons why I follow gold miners is before Bitcoin became the new gold, gold has been an a way to hedge against financial uncertainty, fiat currency challenges, and countries like India and China as they get wealthier, they historically buy more gold.

Critical levels

GDX is a buy right now, with a stop at 33, and a major stop at 26.  The stochastics are favorable for more upside.  The upside in 2021 is about 50, with an upside by 2024 of 90-100.


.

Thursday, January 21, 2021

Bitcoin patience vs greed

 Buying GBTC around 15-20 and selling most of it at about 44 was the best trade in the last year.  


It is very hard to sell when everything is going your way, it looks like the rocket will never end.   In this case most of my funds was in GBTC.   The tell that drove me to sell was the very high premium GBTC was trading at vs the underlying fund value.    On January 6th the premium was 33%, I figured the premium would come out which would result in a lower GBTC price.   But GBTC kept going, Thursday trading at 24%, culminating Friday at 17% with GBTC hitting $48 a share.

There was a market euphoria that hit both Bitcoin and GBTC.  Honestly when I looked at GBTC I thought every sell was a mistake.  But at the end of Friday Jan 8th I sold more.

To see the premium you can go-to Grayscale web site to view the data.  I found another site below.

https://ycharts.com/companies/GBTC/discount_or_premium_to_nav

 Bitcoin and GBTC are starting the capitulation process. My hope is to buy GBTC  26-33 range.  I believe things will ramp up once democrats give more free money to people.  The extra money will go to bitcoin and certain stocks as people try to make a quick buck.

As of Thursday nite, the 21st,

I am 75% back into btc and eth coins, and looking to get 75% into GBTC Friday, especially if it's a gap down open.

Good luck!

I


Tuesday, January 19, 2021

Went HEAVY short the market


One of the chart people I pay for issued an unusual recommendation, short the market index.  I have previously wrote I expect the market top around the 20th through 28th, a Bradley turn date.

Because I was already predisposition to short the market around this time, I went in a little heavy short.  Purchased SDOW and bought some March dated puts, and sold a call dated pretty far out in the market.

I am watching Bitcoin tonight to break down lower or higher out of a trading channel it has been in.

I am extremely light bitcoin ATM, with about 1/5th the bitcoin I had a couple of weeks ago.

To watch the bitcoin channel, click here:

UPDATE:

If the DOW does start to go lower, the low should be above 25K, there is a very good chance we can even go lower.


Monday, January 18, 2021

Watching Bitcoin

 I am watching Bitcoin to send a signal of a new lower low, or moving to next level of highs.

The range I am watching is depicted below.  Any new high would force my hand to buy back into GBTC.  I am waiting to see what direction bitcoin chooses.  My hope is to buy back into GBTC at 26-33 range.


If/when the stock market does to move lower, I do expect Bitcoin to follow.


Sunday, January 10, 2021

When to buy back into Bitcoin

 On Thursday I wrote post Preparing for a GBTC punch .  Looking at the price of Bitcoin Sunday, I expect the punch to arrive Monday.  We shall see!

Last week I sold a little less than 60% of all my GBTC by Friday.  I did actually sell more into Friday's close, not liking the price action.  I also sold BLOK and some Bitcoin miners I repurchased Thursday.

So the next question is, is it over for bitcoin? The high is about 43K for 2021?

Hardly!  I expect this downswing to get plenty of public news.  Friends who know you had Bitcoin say something like "how are you doing?".   But fear not! I think there is more Bitcoin upside til January 28th.  Why then? In the stock market that day is a Bradley turn date which indicates +/- a few days should be the stock market top.  If the market does turn, unfortunately, all assets go down, including likely bitcoin and gold.

So right now we are looking for a bitcoin capitulation day this week, for the rally to resume.  I am thinking Bitcoin should make a high for the quarter around 50-60 k, before we re-enter a consolidation period over the months ahead before 100K at end of this year or early next year.

How can we figure out when is the right time? One was to help with a guess is stock charting.

My stock charting says these are the Bitcoin buy levels : 33K,  26.5K, then 21.5K.

I really have no idea how far this bitcoin correction will go in the week ahead.  I say week since I think by next week the rally will resume in earnest ahead of the 28th.

My gut says 33K will be the low area and we will resume back to new highs.  I believe 26.5k is probably the lowest it will go before new highs, but theoretically 21.5K is possible.   If Bitcoin hit 21.5K, I would feel the urge to sell my other stock positions and just buy all bitcoin.

For GBTC, unfortunately, what we will see is a LOWER price than bitcoin.  If there is a run, Bitcoin may hit 33K and GBTC maybe $29 a share.  The reason is GBTC isn't a peg to bitcoin, but can swing higher or lower depending on supply/demand.


I am looking for a price of GBTC to hit 33 for me to start purchasing, with expectation it could hit 21-25 range.  So I can't go all in at 33, and see if it can get down to 25.  Key is to go in slow, and go out slow, always buying on a down and selling on a material up.  A good trade is good, it doesn't have to be a buy at the low and a sell at the top.


Bitcoin to me is destined to 100K in the year ahead.  So in some ways, all buys are good.  But holding a position seeing the price cut 30-50% is pretty hard to hold.  And new news can come out to change my view that Bitcoin will not hit 100K.  An example is if Biden puts radical tax laws or regulation in to stifle Crypto currencies.

Good luck!


Thursday, January 7, 2021

Preparing for a GBTC punch

GBTC had an epic run late two weeks.  I sold positions over the last two days, but I did keep my core positions.  If GBTC his 33, it is a must repurchase.  

I think the highe for GBTC will be 50-60 this month, but nothing runs into a straight line.

Good luck!

Tuesday, January 5, 2021

Sold Crypto Miners

 I am out of all crypto miners, initial buy started in July in post What Next Gold, Crypto, or Both?

RIOT ~17, initial buy at 2.19 , gains of  776%
HVBTF ~2.30  , initial buy at .60 gains of  383%
HUTMF ~ 3.25, initial buy at .80 gains of  406%

I did not go all in at these prices, nor did I hold and sell all at these prices.
I started to buy in at these prices, and eased out on heavy up days.

With the new year, I am consolidating my positions in:

GBTC
GDX
GDXJ
JNJ
IBB
MJ

Various shorts, Wynn, Tesla, DVA, and own some SPXS, and 2023 'puts' on the DJIA.

Small positions in:
BLOK, OGI

Bunch of small miners, GPL, HL, GOLD, FSM, FFMGF, LUNMF, SVM, AUY, HMY, etc.


Saturday, January 2, 2021

Waiting for a new market high

CORRECTION: 1/5/21 - admitted to SPX 500 not DJIA

The press has called the market at new all time highs, some indexes are.  I always use the S&P 500 for it represents the top 500 companies presenting a more realistic value in the market health, over cherry picking the top 30.

Recently Tesla and Etsy have been admitted to the Dow Jones Industrial average AFTER they had an epic run in value appreciation.   Would have been nice if they put these stocks into the index BEFORE their epic run.    We will see if in 2021 these two stocks beat the value appreciation now that they are in the index.  I suspect smart money is unloading their positions at a profit to the people buying the index.  We shall see.

Back to my point about the S&P 500, currently SPX stands at 3,756, which beats the old high in February 19th 2020 at 3,386.    The USD was valued at  99 compared to other currencies, and is now valued at 89.   That is a full 10.1% drop in US based asset values.  Adjusting the latest high at 3,756 we get  3,380.

So the overall US stock market still hasn't beat it's old high after the US Government spent Trillions of dollars, with the FED spending 4 Trillion buying private assets.

I wrote this previously in Resuming the Market Decline ahead on December 2nd, I am of the opinion once Biden takes office the Republicans will start to beat the deficit drum and curtail all government spending after the worst economic downturn since the Great Depression.   The irony of course is during the greatest economic era ever declared in January 2020 we had an annual deficit spending of  1 Trillion. (984 Billion on the books).

So with the fragile economy, its a no brainer 3 Trillion isn't outrageous with such huge economic challenges.  If the Democrats win both senate seats in Georgia, the market should stay within a 25% lower low in my opinion as the Democrats dish out free money to everyone.   Assuming they don't win those seats, the cut in spending will result in sky rocketing foreclosures and cascading deflationary outcome. A stock market 60% lower over the next 4 years would not surprise me.

I am writing this for the benefit of my future self, when I can hear as we enter the 2024 election how the Democrats wrecked the economy  and we need to elect a super-right wing person to whip this nation into shape.  For the record, above is what will determine the outcome.

If the Democrats do get full control, I do expect the USD to hit new lows relative the the world.  We could have a market that hits SPX 4,000 but USD is down 30% from the highs.  In a deflationary collapse the USD will regain its value but the market will suffer greatly.  Remember all imports get more expensive as each USD is worth less.

Either way, that is why I am in Gold and Bitcoin.  Bitcoin hit 33K and I still think 100K is a possibility in 2021.  My target date to get nervous is after Biden assumes office and Trump has admitted he is no longer president.

Good luck!