Welcome new reader!

START HERE, READ THIS FIRST.

Sunday, January 17, 2010

Chartists and Catastrophic Wave C

From WebSurfinMurf's Financial Blog


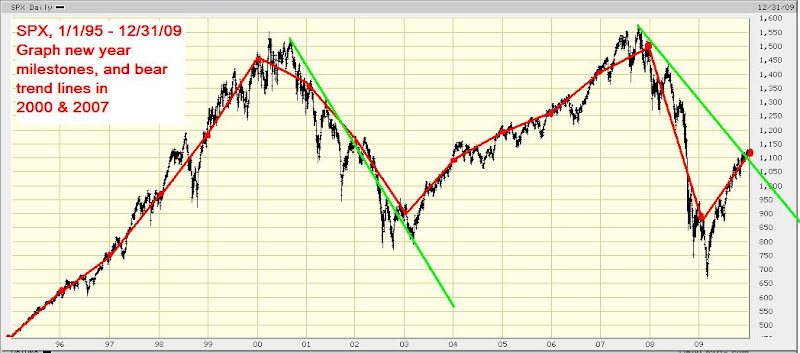
There are many schools of thought on how to predict market trends. All of them are flawed. But many make excellent history-documentation systems, meaning they can't predict the near term future but can as we use a very large etch-a-sketch creating the stock market indexes document the market's movements.

Some use time and general repeating history trends, like a drum beat, showing how the market has cycles every X period of days. The Smart Money Tracker seems to use something like that, I am not fully able to comprehend all the data he uses for his prognostications. To Gary's credit, his drum beat seems one of the most accurate from my perspective. Pay for his service if you want to learn more.

Another system is stock chartists. Stock chartists use patterns to "document" historical charts, and using such a documentation system claim to be able to forecast where the market is going. The (voodoo?) science is extremely detailed and to me, interesting. This system has been in-place for decades being used to assist armies of chartists in market investing.

To explain the US stock market history, back to the great depression, and the chartists view of the market trends to today is beyond the scope of this blog. A short summary by McHugh is available here. For more information, see Elliot Wave International and check out their books or pay for their service.

The bottom line is, all of the chartists I have followed have said, we are approaching the biggest swan dive ever witnessed in the US stock market. Their view is 2008 was an opening act. Ignoring the argument whether Elliot Wave charting is science or sophisticated palm readers, one thing is clear, their voice and viewpoint does give the markets something to listen to. To me it's like listening to Fox news, or NPR, the information generated may only have a grain of truth, but when people are nervous, the spin voice gets more weight.

So when these chartists say, that "Catastrophic Wave C" has begun, its prudent to pay attention. Catastrophic Wave C targets the stock market BELOW the lowest levels we have seen to date. This will take place, according to chartists, on an undetermined time line, but once started, the markets will not see a new high beyond the start for years. ( I am leaning towards the bottom of this swan dive may rise hyper-inflation that will have the markets far exceed the highs, but then again so will everything else.)

Elliot Wave international has announced, it has begun on Friday. McHugh, another chartists with a pay service says they SUSPECT it has begun.

McH
ugh is of particular interest. Back in August of 2009, McHugh called for the Dow Jones Industrial Average to reach a high around 11,000. This past week at close Thursday the markets reached a high of 10,767. If that was the final high, hats off to McHugh, thats a pretty good call over 6 months ago. Since McHugh called this (so far) correctly, vs Elliot Wave International who thought the high was August 2009, I am putting a little more weight on McHugh. (Of course, I listened to EWI instead of McHugh....)

McHugh's pay service also announced the POSSIBLE start of catastrophic wave C on Friday. They have a few more indicators that have to trip to confirm this has begun.

The fact that both these chartists are now almost in agreement, unlike in 2009, should give any investor pause for concern. The chartists (voodoo) science isn't worth debating. What is important is to recognized there are legions of investors who do believe in Elliot Wave Analysis. And what is more important is they will en-mass in a reasonable time-period come to the same conclusion. And that may be the trigger for the sell off.

Charting, to me, is either a valid science, or merely a science that becomes a self fulfilling prophecy tool. In either case, time to wake up and pay attention to the stock markets. The greatest come-back in the history of the US stock market may be over, (72% in 10 months) it may be time for the bear to return.

Control people through pain or pleasure

Good commentary on society today in the comic below, found on the Slope of Hope.
If you think about it, pretty much is a commentary that communism ruled by a stick, and capitalism ruled by a carrot. And what we are witnessing is the extreme conclusion of capitalism today.

I agree, Huxley was right. Enjoy (Thanks to John for the link)
From WebSufinMurfs FinancialBlog2


Saturday, January 16, 2010

Financial News Hour

One of the podcasts that I don't listen to enough (there just isn't enough time) is Jim Puplava of the Financial Sense News hour.

One of the podcasts the site creates has one on the financial crisis, but one special guest is Dr. Robert McHugh of http://www.technicalindicatorindex.com/. This podcats covers several books and gives some 2010 forecasts.

I recommend you go to the homepage to check out the material there.


Thursday, January 14, 2010

This isnt a typical recession, revisited

A while back I posted the chart below from Mish's blog. This time, a blog called Financial Armageddon put together some interesting charts worth looking at.

I lifted only the first chart, got to click to the blog to see the rest. Pictures tell the story. The takeaway to me is, this isn't the typical recession. I doubt charts presenting the downturn like this would ever appear in a mainstream publication.

Click on image to see the full blog article.


From WebSufinMurfs FinancialBlog2


Wednesday, January 13, 2010

MainStreet Media starting to get it

An editorial in the NYT is refreshing, but much more focus and wide coverage around the financial dealings with the citizen's money needs to be done.

Click to read full article, snippet below:

Why was our money used to make these high-flying gamblers whole while ordinary Americans received no such beneficence? Nothing less than complete transparency will connect the dots.
.......
If they all skate away yet again by deflecting blame or mouthing pro forma mea culpas, it will be a sign that this inquiry, like so many other promises of reform since 9/15, is likely to leave Wall Street’s status quo largely intact. That’s the ticking-bomb scenario that truly imperils us all.


Make no mistake transparency will bring stocks down, and a jolt injuring the economy, but so will long term malfeasance. Best to get to business and clean house rather than let malfeasance fester over decades like Japan.

Tuesday, January 12, 2010

Unprecedented Market Rally in History of US Stock Market

Monday the US stock market is breaking records for highest percentage gain without a significant correction unseen since the 1930's. For those of you not familiar with history, 1929 marked the worst stock market crash in modern US history, followed by the largest percentage rally in US history, followed by the Great Depression.

The stock markets have climbed higher today, but on low volumes. Two of the services I subscribe to, which I highly recommend, is The Elliot Wave International Financial Forecast & Gary of the Smart Money Tracker. What I find fascinating is two different respected market technicians I follow, Elliot Wave and Gary of the Smart Money Tracker have significant contradictions on the next market move. Gary in a recent post pretty much called charting ignorable, since the market will follow it's own trajectory. EWI has quite a lot to say about the current market retrace using charts.

For me, charting isn't a predictor (aka Gary), but it does serve to illustrate extreme situations, which puts context in historical, and therefore probability. But for anyone who has been burned at the Casino knows, the most improbable can happen when least expected.

This months Elliot Wave International issue of the Financial Forecast (Jan 2010) has much to say, Two charts I asked for reprint permission for my blog, and are presented below. I do believe has impact as it tells a startling story. The first graph compared the start of the Great Depression where the US stock market retraced 52.3% before its multi-year decline. The US stock market is over 53% retraced, surpassing the Great Depression rebound. That alone should be a warning sign that things are not normal.

But as Mish's Global Economic Trend Analysis points out, the more recent event of Japan shows it's stock market retraced 140% from it's low before it resumed its 2 decade devaluation which continues even today. As Karl of the Market Ticker points out, Japan is considering such drastic measures as to put the currency at risk, and by the Japanese central bank continuing to promote its 2 decade failed (and wrong headed) battle to turn the economy around through fiscal games. If anything Japan illustrates what the US will probably do, repeat the wrong headed policies until the implosion of the US dollar. Hopefully Japan beats the US to it, and the US wises up from that event.

But I digress. The important point is even with a failed economic policy, counter rallies can extend farther than anyone would expect.

Another chart from Elliot Wave shows in context from the .com bubble and now, illustrating events that mark a likely market top. This includes glorifying the Fed chairmen who brought the US financial disasters to our doorstep in the first place, investor confidence at all-time highs, these are all typically contrarian indicators.

So while all indicators are pointing to a massively over-valued US market, Japan shows we could have a long ways to go, as per Gary. Elliot wave is trying to pick the top, which I have personally experienced is a fools hobby. In any event, all of this should tell you, we are in abnormal times, and ensure you pick your pain points to change investments.

From WebSufinMurfs FinancialBlog2


From WebSufinMurfs FinancialBlog2

Monday, January 11, 2010

Unavailable first half of this week

I will be unavailable to post on this blog through Wednesday, but I may be able to find some time.

The markets soaring on an already over-extended run, farther than the 1930's, is disturbing to say the least. What we now face, due to the interference on a grand scale by the world governments is one of two "broad" scenarios. A large market correction, over months or many years, or currency crisis.

The currency crisis will be in the form of currency devaluation to a new low, and that will send commodities, something that the world is competing for, into a price surge up. Ironically, that is the theme I starting talking about in the fall of 2008, and why back then I bought gold miners (but didn't hold).

Gary of the market ticket expands on this thought, and pretty much says doing chart patterns is idiotic. If inflation does come, in the form of currency depreciation, the markets returning will look like a party until the bill comes. Then through the face of rocketing resource prices, then the market will fall.

Sunday, January 10, 2010

Playing Bond Markets

For those who don't have the savings to play in the bond market, or lack of knowledge of how to do so. (thats me), there are some interesting ETF's.

Check out these ETF's
Leveraged
TYD, TMF, TYO, TMV, TBT

Non-leveraged

TYX, TNX

I am very sure that there will be volatility this year in the leveraged ETF's. Worth checking out. Remember, the 2x and 3x funds tend to lose money over time due to expenses.


Saturday, January 9, 2010

The Secret of Oz

I recently watched a great video called The Secret of Oz. You can purchase it at Amazon (click).
UPDATE 10/3/11: FULL VIDEO HERE

I highly recommend anyone who would like to know the US history on currency, and the Federal Reserve Bank. In a nutshell, Mr. Still covers how the country originally did not need banks to create money. The Federal Reserve Bank is the 6th incarnation of the banks involved in money creation.

Sure, some of this sounds a bit fringe, but the history presented made me think more critically about the US debt and financial system.

The backdrop of the movie is explaining how The Wonderful Wizard of Oz was a story created using symbolism of the US monetary system. For example, the gold path is gold, etc.


Thursday, January 7, 2010

Great Quote from Mark Faber

“The federal government is sending each of us a $600 rebate. If we spend that money at Wal-Mart, the money goes to China. If we spend it on gasoline it goes to the Arabs. If we buy a computer it will go to India. If we purchase fruit and vegetables it will go to Mexico, Honduras and Guatemala. If we purchase a good car it will go to Germany. If we purchase useless crap it will go to Taiwan and none of it will help the American economy. The only way to keep that money here at home is to spend it on prostitutes and beer, since these are the only products still produced in US. I’ve been doing my part.” - Marc Faber

Thanks to John Chinnock for the quote.

Wednesday, January 6, 2010

Hussman Funds

One of the blogs I periodically read is on the Hussman funds web site.

Below is a snippet from the most recent article. Click to read entire article here. Its good to see people like hedge fund managers are capable of seeing what is really going on.


January 4, 2010

Timothy Geithner Meets Vladimir Lenin

John P. Hussman, Ph.D.
All rights reserved and actively enforced.

Reprint Policy

“The best way to destroy the capitalist system is to debauch the currency.”

Vladimir Lenin, leader of the 1917 Russian Revolution

Last week, while Congress and the nation were preoccupied with the holidays, the Treasury made a Christmas eve announcement that it would be providing Fannie Mae and Freddie Mac unlimited financial support for the next three years. The Treasury's press release notes:

“At the time the Federal Housing Finance Agency (FHFA) placed Fannie Mae and Freddie Mac into conservatorship in September 2008, Treasury established Preferred Stock Purchase Agreements (PSPAs) to ensure that each firm maintained a positive net worth. Treasury is now amending the PSPAs to allow the cap on Treasury's funding commitment under these agreements to increase as necessary to accommodate any cumulative reduction in net worth over the next three years.”

Put simply, in a single, coordinated stroke, the Treasury and the Federal Reserve have encroached on spending powers that are enumerated for the Congress alone. Under the Housing and Economic Recovery Act of 2008 (HERA), the Treasury has no such open-ended authority. Indeed, the applicable portion of the Act explicitly limits the total amount of mortgage principal (not losses, but total principal) as follows:

"LIMITATION ON AGGREGATE INSURANCE AUTHORITY.—The aggregate original principal obligation of all mortgages insured under this section may not exceed $300,000,000,000."

Tuesday, January 5, 2010

All of this will end badly

US dollar is finally on the mend, US stocks hit new 12 month highs, US manufacturing increased in December. All is well, and another 5 year bull market is to begin.

Or is it? I really want to believe it. I would love to just end my fixation with the stock market, go back to focusing only on computers. But I know that the largest financial bubble ever created has weakened, and all the printing of paper, changing accounting rules, and lack of law enforcement will NOT result in prosperity.

What I don't know is how the downside will manifest. Stock market collapse lower than before? Market flat-lining 30% lower? US dollar collapse? Hyperinflation?

Point is, this rally will continue to whatever level the steam runs out. Heck, another 6 months is not impossible.

But a few facts to consider.
  • Root problem of the financial system as not been addressed, only papered over.
  • The greatest stock market rebound since 1930 is now. SPX 666 straight up (almost straight) to SPX 1132 today in about 9 months.
  • US dollar recently retested historical lows before firming up. US dollar isn't high enough to call it safe from being devalued to new lows.
  • Unemployment is about 10% officially, and closer to 16% if you include underemployed and those who couldn't find a job after benefits expire.
  • There is no growth leadership industry. late 90's was Internet. 2002+ was cheap loans to finance very nice large houses. As covered already, 30 year interest rates for US treasuries is approaching a long term trend line, that if broken, will signal significantly higher rates.
  • Events like Iceland collapsing, Latvia, Greece, Ireland, and other countries under severe pressure from world community. Large corporations failing or becoming zombie institutions under government control.
These are NOT normal times. Hence the reason why laws are not being enforced, and litterally trillions of taxpayer money is being used to cover private debts.

But covering debts doesnt make it go away. It shifts who takes the hit from the bad investments. If capitalism was adhered to, the investors of the corporations who took too much risk would fail. That's it. The economy would take a significant hit and begin to rebuild.

But instead the losses are shifted, not eliminated. The manifestation of those losses will come as higher interest rates for eveyone and every business, US dollar devaluation, or some other way. The losses just don't go away with no impact.

So rejoice the market is higher. But if the market goes 100% higher, everyone's life savings will be destroyed through inflation. If interest rates rise in response to ridiculous spending curve of the US government, then housing will fall, more companies will fail as debt load will cripple, and US government budget will get pinched as the 15 trillion of debt has a higher cost to maintain it.

The image on this blog states "There is no such thing as a free bailout", and I firmly believe it.

Monday, January 4, 2010

2010 Predictions

I made quite a few very specific predictions last year. This year I want to try something different. That is, to make a few general broad statements of where I think the markets will be 1 year from today.

This serves two purposes. One to provide a clear, concise view with less confusion in the predictions. Two to mimic what most people are trying to do, and that is pick a place to put some savings into.
  1. 2010 will reach a crisis in the US bond market. Interest rates will (if not already) become a concern and will need to be put in check. Rates will over all drift higher, squeezing the life out of the US government and economy. Rising rates will apply downward pressure on housing.
    a) Disclaimer: US rates will NOT be a concern if the US stock markets collapses in 2010. We are talking down for the count collapse.
  2. US stock market will be lower on 12/31/2010 than 12/31/2009. Guesstimate is a wide range, SPX 1,000 to as low as 500. Since that is pretty ridiculous range, I'll choose 750
  3. Inflation, despite everyone's concerns will NOT manifest. However, Currency devaluation is possible, and that would be reflected in higher commodity prices. US Dollar gains strength first half of 2010 in general, and loses strength, in general towards end of 2010. US Dollar remains above the lower trend line, as depicted here (click) for 2010.
  4. Precious metals (gold) will have major valuation issues between Q1 and as late as Q3, but should firm up between Q2 and Q4. I am very sketchy on time line, since precious metals valuation turn around will depend on US dollar, interest rates, and stock market fear.
  5. With that said, Gold will end higher at the end of 2010 than current levels or at the very least rising rapidly to surpass current levels. (from it's low)
  6. US economy will NOT rebound, and will be in a quagmire of problems straight through 2012 and beyond.
  7. There will be major crisis in 2010, including, but not limited to: State(s) faulting on debt, counties failing (avoided in 2009), more countries failing, and in general, increasing unrest in the world (wars, terrorism, etc)
  8. Protectionism will continue to rise (tariffs, refuse to trade, etc)
    NOTE: This is one potential event to destroy stock market valuations.
this list is pretty broad. But it covers 8 specific points that can be judged on. Items 7/8 are a little squishy, but I should be able to look back to judge.

Feel free to put in the comments your own 2 cents, and I'll try to add them to my end of 2010 summary.

Sunday, January 3, 2010

2009, A year in charts

It helps to take a step back and put a little perspective on things.
Today's post is 2009, with various charts showing 2009 in context of the last 2 to 14 years (depending on stock)

In general, pay special attention to the US 30 year treasury rates, this is a hint of what is to come.
From WebSufinMurfs FinancialBlog2

From WebSufinMurfs FinancialBlog2

From WebSufinMurfs FinancialBlog2

From WebSufinMurfs FinancialBlog2

From WebSufinMurfs FinancialBlog2

From WebSufinMurfs FinancialBlog2

From WebSufinMurfs FinancialBlog2

From WebSufinMurfs FinancialBlog2

Saturday, January 2, 2010

Wednesday, December 30, 2009

2009 Predictions, closing the year out

Back in January 2009, I was a tad bit cockier, as having a great two years in investing.
I posted 2009 market predictions and market trend predictions relating to finance and some politics.

In July, I posted Half Way to Hell, my commentary on the scorecard so far, and what remains.

How funny my 2009 opening lines read now, I quote:
I'm hoping I am becoming more accurate in my time line, and the person I am now would not have predicted complete collapse in 2007. I have learned the world moves slowly, but when the panic hits the heart of people, it moves quicker than anyone can imagine. In large numbers, fear is more powerful than greed.

The world moves slowly? And here I predicted it would move quickly in 2009. Ha!
I didn't listen to myself on how slow the world would move!
So lets cut to the chase. 2009 greatest hits and misses, see Italic BOLD for current commentary

2009 predictions met
  • Unemployment will hit 8% in 2009 in official figures, unofficial (REAL) numbers easily top 12%
    Real unemployment officially over 10%, unofficially easily at 15%
  • All countries will continue to race to devalue their currencies. The race to devalue will help ensure the US Dollar doesn't collapse as compared to it's peers.
    I count this as a win, the world is trying to race to devalue their own currencies, US dollar did devalue, but has been rallying back. USD did not collapse
  • Oil will hit 50 bucks a barrel in Q1 2009. Oil will hit over 60 a barrel before EOY 2009.
    Check, hit 49.47 in Q1, it hit about 67.56 bucks a barrel in Q2 (both hit higher in reality)
    Oil hit over 80 bucks a barrel in 2009
  • Oil for shorter term traders, on the pop up in Q1, will sell significantly out of this trade. Oil went straight down from 140 to 36, it needs a counter rally.
    Oil hit over 80 bucks a barrel in 2009
  • Gold, Oil, and resource plays are NOT guaranteed safe heavens, but over all investments, it will fair pretty well compared to the alternatives. See previous bullet as to why. GDX will hit 55 a share in 2009, wouldn't surprise me if this occurs in Q1.
    Check, GDX hit 55.40 in 2009
Near misses for 2009
  • Obama cannot save the USA and the world in 2009. (proven in short order
    Cant prove either way, so took it out of the met
  • With all this doom and gloom, predict the market WILL RALLY, sometime in Q1/Q2, and fool people into thinking the market has recovered before failing again. From 2009 market top to bottom will exceed 50%. (hence why I am long currently resource stocks/oil)
    Market did retrace 50% back up, as of December 2009, so we did retrace, but through Q4
  • DOW will hit below 6,000 (I'll take ANY bet on this one). And it wouldn't surprise me to hit DOW 4,000. (over 50% drop from current position)
    I thought below DOW 6,000, hit 6,469.95, off by 7.8%
  • Counties and states will face financial crisis, as many as 5 counties will outright fail in 2009, causing municipal bonds to sway.
    Many taking drastic action, .states like California have had major financial crisis, same with counties. But I haven't read of 5 counties failing.
  • Stock DECK (at 80 now) will trade at below 25 a share by Jan 2010 (may need extra month for earnings report)
    Near miss Went to 37.25, in 2009.
    And I suspect a complete miss for the price target by Jan 31 2010 of 25.
  • Gold valuation is unknown for Q1/2/3. Long term Gold is a great buy here again, and will be higher in the next 2 years. GDX is is currently at 33, and will hit over 55 in next Q1/Q2, target is close to 100 in 2009. This will be due to golds high price, but low energy costs and cheap labor (other miners such as copper laying off in droves).
    As previously mentioned hit 55 2009, 100 will be at end of 2010 possibly. So half right.
  • Inflation in Gold, Oil, or Food, will occur in 2009.
    I qualify this as a hit, as resources as measured in US dollars, did go higher
  • If gold collapses, will recover by Q4.
    Gold didn't collapse until extreme late Q4.
Misses for 2009
  • More insurance companies will have severe financial issues.
    There has been serious problems at various insurance companies surfacing, but as a whole, not severe.
  • The housing collapse is 50% there, as per my previous entry. The NorthEast will see acceleration as the financial market layoffs take effect in the region.
    Not achieved, and there is no recovery, but cracks are appearing
  • In Q2, the market will pull back, sucking the bears in for the short of a lifetime. They will be disappointed as the market rallies back in Q2/Q3 and hurts the bears.
    I WAS the sucker that I predicted! And the rally extended through Q4 DESTROYING bear traders
  • Deflation will "win" in wages, stocks, and real estate.
    Wages check, real estate - check, stocks - WRONG
2009 Debacles - Big Misses
  • The ETF SRS will hit over $200 a share in 2009, currently at $53. May hit $25 before $200. Over $500 a share would shock me.
    SRS hit below 25 a share, its at 8 bucks, hardly a miss, its a huge miss on 200 buck target.
  • The market will have a rally over Obama and his policies to save the world as the new savior. The rally (or trade sideways, lack of collapse) will last into Q2
  • After the rally of Q2/Q3, the market will finally collapse to new lows in Q3/Q4.
    Obama Rally lasted straight into the end of 2009
Summary
Over all, I have to say my predictions werent a complete debacle, but there is enough wrong to not count it as a banner year for meeting expectations. For 2010 predictions, I'll try to be more pointed in predictions, and keep it to a few. Often palm readers and other prediction nuts use the technique of predicting 1,000 things and highlight the right to paint themselves as good visionaries.

I had too many diverse thoughts, muddying the assessment.

Tuesday, December 29, 2009

S and P 500 new highs

Monday December 28th, the S&P 500 hit new highs, 1,130.38, as well as some other market indexes. What amazes me, that it wasn't significantly higher. On December 26th, the US government announced that all losses, no matter how big, are 100% backed by the US government from private institutions Freddie Mac and Fannie Mae. By inference, the market can assume that this isn't the last no-hold-bar, we got your back maneuver, and that there is more to follow.

With a one-sided bet, all upside, and no downside now in the pocket of private large financial institutions, I expected a much higher blow off. The last week in December is so far extremely light on volume. I would not be surprised to see the S&P 500 hit a new high of about 1155 before this market finally turns.

However, make no mistake, these actions are sealing the US fate, if not the world to a horrible multi-year economic downturn, similar to Japan's lost 20 years trying to cover their debts through government intervention. Japan was a CREDITOR nation, and that country took similar steps to prevent their companies from taking huge losses through government intervention. The result was that stock market fell from 40,000 down to 7,000 to 20,000 range for 20 years, currently at 10,800. The US is a DEBTOR nation, and if in the next 10 years the US can muster it's currency from collapse, and keep market valuations higher than here, then that is a great feat.

So, yes, the market made new highs. But nothing is fixed. All that has happened is transferring risk from the private sector to the US government, and by inference, the solvency of the nation. This fixed nothing, and is a direct repeat of history from Japan to the US's own great depression.

The wall that the world will hit, is the US bond rates. That is already happening as 30 year bond rates are creaping higher. There will come a point where mortgage rates will rise enough to further crush housing prices. And the government will have to choose, the stock market or the housing & debt market. To me the choice is clear, tank the stock market and save the debt market.

But one thing 2009 has taught me, stupidity runs no bounds, and the choice may be to crush the housing and debt market, and throw this country into a GREATER depression in an effort to keep the stock market valuations higher.

Happy Holidays, the multi-millionaires got their bonuses, and trillions in government handouts, what will be left for the pension funds, retirees is going to be coal in a few years.

Monday, December 28, 2009

Twitter

I ran across http://FedUpUSA.org twitter account here (click).
Worth following for highlighted stories.

I really don't feel like posting on the market today, I will close out 2009 prognostications and create 2010 prognostications.

I am so disgusted by the actions I posted on Sunday.

Sunday, December 27, 2009

US has abandoned all fiscal discipline

On Sept 6th, 2008, the US government took over Freddie & Fannie, I wrote a blog post titled "Financial Ground Zero", where I marked that event as the potential beginning of the end for the Financial system in America.

I have hoped, and continue to hope that America's Government decides to stop the insanity of trying to expand the US debt to any level, at any cost. The end result if left unchecked is US dollar collapse or interest rates soaring as the US government tries to defend its currency, and its legitimacy as the ruling government.

On December 26th, 2009, the Obama administration has announced the US government will take private investments in the Freddie Mac and Fannie Mae corporations and make the losses in those government institutions part of the public debt. Simultaneously, it also announced a 70 million dollar bonus for 12 executives running these companies over the next two years.

Making private losses part of the US governments budget is outright illegal, only the US Congress has the authority to appropriate funds. But the word legal is no longer defined as what the constitution reads, but what is enforced.

This one act, isn't the end of the US government, but it definitely puts the path ahead straight towards that destination. The US government has now made it crystal clear, that all losses, no matter how much, from banks, mortgage companies, car companies, are the public's responsibility.

This sets the tone in stone, that all large corporations should not fear insolvency, Uncle Sam has a printing press, and will use it.

Oh, to boot, since World War 2, all oil purchases have been made in US dollars, with some small percent as an exception. The four Oil gulf countries (audi Arabia, Kuwait, Bahrain and Qatar) announced their own currency to be created, presumably that the world will need to convert to the gulf currency to buy oil. As if that wasn't enough of a blow to the US dollar, the Central banks of the four Gulf countries will halt their lending operations next week in line with their landmark agreement to launch the world's second major monetary union, a Saudi newspaper reported yesterday.

So lets recap, the US is on a debt binge, passing universal health care, covering all losses from two companies that own 5.5 trillion dollars worth of mortgages and counting, and one of the strengths of the US dollar, being used for oil purchases, is on the verge of evaporating soon. This is ontop of my other Financial Ground Zero moments I have noted since the original Fannie/Freddie takeover.

I'll be posting my 2010 predictions, and at this point, its not going to be a fun read.
Fasten your seat belts, inflation, deflation, currency collapse, or interest rates soaring, something is going to give, and the masses will pay for it.

MicroPoll Results

Today I'll just post some nifty fluff, results from the polls done to date.
Question that was asked at top of each poll
Did you have more presents given to you, and purchased by you this year over last year?
Results link, map below by region


On Dec 31st, 2010, what do you expect the DOW index to be at? (2009 high 10,504, 6,478 the low)
Results Link, map below by region


Do you believe the US economy has seen the worst of the economic downturn, and is on the road for a multi-year recovery?
Results link, map below by region

Tuesday, December 22, 2009

Stock Trader to watch

There are tons of 2 bit (like here) blogs where plenty of BS for stock trading is available.

But there is a bottom line, and that is, what is the RECORD of the trader.
My record for 2007-2009 spring was pretty darn good. Not so good since July.
But I'm not going to go into detail.

There is a site called KaChing where traders can tie their trading to the web site to have verified positions and results. Basically put up or shut up. The site is pretty interesting.

One trader I have been half watching for a year now is Atilla Demiray of blog xTrends. He is a "bear" on the market, but to his credit will flip sides as he see's fit. But definitely leans towards shorting.

Atilla is up 60% since September, not too shabby. As of this blog entry, he is down about 3 million on his most recent positions (wow), but I guess when up 60% and trading capital of 40 million, all in a days work.

Better yet, find a KaChing designated "genius" and you can setup your interactive brokers account to mirror the genius traders moves automatically! Who needs a stock broker giving advice "do as I say not as I do"? These guys show the money they risk, proving their personal conviction. All of this is high risk, of course, but interesting none the less.

Monday, December 21, 2009

This week in Charts

Another week has past, and the holidays are upon us.
I may give this blog a break from the 24th through Jan 2nd, with an occasional post instead of daily.

For now, lets look at the charts, and see how the markets look. I threw on a chart of US debt vs the world from The Market Ticker, pretty interesting.

From WebSufinMurfs FinancialBlog2

From WebSufinMurfs FinancialBlog2

From WebSufinMurfs FinancialBlog2

From WebSufinMurfs FinancialBlog2

From WebSufinMurfs FinancialBlog2

Sunday, December 20, 2009

More evidence China is not the near term solution

Mish's Global Economic Trend Analysis had a good article this past week on China.
I have posted quite a few times on China, and in the last 6+ months, how China is NOT in a position of strength. Sure, long term, between now and 2035 China has a rosy future, but quite a bit can happen between now and then.

My previous blog post Chinese Economy more fraudulent than USA showed plenty of excess capacity in some of China's largest cities. In one city, more excess commercial space (unused) than the entire commercial space available in Manhattan.

But this next video takes the cake. An entire city built without the people of China being able to afford to live in it. Why may you ask? China is operating in the global insanity that the US also follows, as described in Misrepresenting Economic and Financial Data. The explanation in Mish's post on why China has so much overcapacity is China paid people to build the city and other excess capacity, so the WORK DONE can be counted towards China's total GDP!

This is clearly an active distortion of reality, building a city, to not be used, but to count the work, and developed real estate to build up China's numbers is a distortion of productivity.

There is no one country that can save the world from itself. The lies must result in losses, and the cleansing must occur before the next economic cycle can begin.
The good news is, once this downturn ends, the next economic upswing should bring on a fantastic growth period.

Watch this video, to scratch the surface of understanding the mentality of a country to build an empty city, then think about the massive inefficiencies/distortion/over valuation that must be through the entire country of China. Frankly, its incomprehensible.

Saturday, December 19, 2009

Jim Rogers says invest in food

Jim Rogers on a wide variety of commodities, including gold.
Right now Jim Rogers is a US Dollar bull


Friday, December 18, 2009

Time to buy Gold Miners?,,,,Again?

REMINDER: Saturday is once again options expiration. Expect market games between Friday and Tuesday noon.

Thursday the Gold Miner ETF, GDX, has hit the long term bull tend line. If you are in the camp the US dollar is about to implode any day now, and Gold is the only "real" money, now isn't a bad time. You could buy GDX at this level, and set a stop-loss point at around 44.

However, for me, I can't do it. From a charting perspective, seems like a decent play with a set risk threshold. My problem is the stock market I still believe will correct. And I can't see how gold miners explode higher if the market is falling.

Oh yea, there is also the US dollar. As the USD gets stronger, I have a hard time seeing gold explode higher. It can, there is no tie between the two. But it is an uphill battle.

From WebSufinMurfs FinancialBlog2


From WebSufinMurfs FinancialBlog2

Thursday, December 17, 2009

The Bond Wall

After the market crash in 2008, the answer to Time magazines person of the year, Ben Bernanke, savior of the world, was to create money and fund insolvent corporations.

Combine this with the US congress spending into the trillions, the US is showing its over-the-top disregard for fiscal responsibility.

So, who cares? When money is "created", the mechanism, as previously covered, the US government must issue treasury bonds. The yield, (interest rate) of these bonds are not dictated by the US government, but is set in the market place. For example, if the government wants to sell 100 billion dollar of US 30 year treasury notes at 0.01%, then can offer them, but it is likely not one person will buy it. So the government would raise the rate until the bonds are purchased.

Higher interest rates have huge ramifications on the US government and the economy. As rates rise, corporate debt rates tend to raise also, as corporate bonds typically need to offer higher yields than US treasuries to "compete" in the bond market. Mortgages are indirectly linked to US treasury yields. For example, if US treasuries had a yield of 30%, it wouldn't be possible to find a bank willing to lend you 400K to buy a house at 5.5%. The bank would be better off buying US 30 year bond notes with much less risk than lending me the money to buy a house.

If mortgage rates rise, say from 5% to 7%, house prices typically fall to keep the same monthly-payment for the buyer to be able to afford the house. Each point can mean upwards of 10% fall in housing prices. For example, 30 year mortgage on 400K at 7% is $2,661 vs 5% is $2147. at 7%, to get a monthly payment of $2147, the house price must drop to 323k.

The competition for cost of debt ripples through the entire economy. I have posted many times, that the real fireworks will be the bond market. The 20008 market crash was an opening act, a prelude to wake people up of more to come.

This ridiculous idea that deficit spending will lead to prosperity, and giving insolvent companies larger credit lines will have no effect on main street is outrageous. As the bond market demands better returns on a higher risk debtor - the us government, the cost of everything in the economy feels the effects through increased cost of debt.

THERE IS NO SUCH THING AS A FREE BAILOUT.

Which leads me to the graph below, the US treasury, 30 year interest rates. As you can see, the trend is up, at about 45 degree angle. Rates are reaching into the range of pre-market crash prices, and threaten to continue into July 2010 to new highs.

Hopefully the man of the year, will have an answer on how the US can produce infinite amount of debt and keep the cost of that debt low. Ben knows the answer, FEAR. If the markets enter a fear state, people will run to bonds, applying downward pressure on rates.

The other option is stop issuing new debt. If the government doesn't issue new debt, it can set the rates to anything it wants. if no one buys, government wouldn't care, and it can then set the price. But the government lives in debt, so it MUST find a buyer, and therefore will increase rates to find buyers.

The wall is coming, I don't know the magic number, but at some point, as rates rise, the Federal Reserve bank will need to choose, the economy or crush the stock markets.

From WebSufinMurfs FinancialBlog2

From WebSufinMurfs FinancialBlog2

Banks CEOs tell Obama they run the show

In what I consider a real slap in the face, a few bank CEO's at the last minute excused themselves from meeting with President Obama, with some flimsy excuses.

Goldman Sachs CEO Lloyd Blankfein, Citigroup chairman Dick Parsons, and Morgan Stanley CEO John Mack all skipped out on a scheduled dressing-down today from Barack Obama because "inclement weather" made it physically impossible for them to travel to Washington.

In my 20 years of traveling, I have missed one appointment due to flight issues. No matter what happens, I scramble to work around a flight issue, and I do NOT have access to a private corporate jet. I have flown into neighbor cities and drove to locations. For important meetings I always fly in the night before the meeting to allow for problems and recover.

Apparently these 3 CEO's left zero room for error for the meeting with the president, and a flight issue caused them to not show up. I wonder how come their corporate jets weren't able to fly instead of taking a commercial flight.

Nice try Obama, you don't run the country, the banks do.
But this does give me optimism, perhaps Obama is a quick learner, and is starting to get more firm with the banks behind the scenes.

Wednesday, December 16, 2009

Misrepresenting Economic and Financial Data

I am happy to get back to my monetary post series starting with What is Money, Creating Money and Credit, Economic and Monetary Inflation and Deflation.

Next up is misrepresenting economic and financial data.

As described in the series, Money, in an ideal state would have the same worth for work today, for work tomorrow. But because of various monetary policies, the value of money may vary significantly over time. Most people believe that it is inherent in paper currencies that they devalue over time. For example, in 1939, a gallon of gas may have cost 10 cents, now it costs 4 bucks.

But currencies do NOT have to devalue over time. This is a result of the fiat currency, fractional reserve lending, and the Federal Reserve bank. All of which America did NOT have until 1913, when the Federal Reserve Bank was created. Before this event, a person could take a US dollar bill, bury it, and 100 years later it would have the same purchasing power. As a matter of fact, if you bury 100 dollars in 1800, in 1900 it would have MORE purchasing power! (Click here, try 100 bucks from 1800 to 1900, then try 1800 to 1922, and continue into the future)
The old monetary system also had issues, specifically it was linked to gold directly, which resulted in periods of uncontrollable deflation. But the net result over time was a stable currency value system across generations.

Think about that for a second, "A dollar saved is a dollar earned" actually would be true. Now flash forward to today. $100 us dollars in 1808 saved would have purchasing power of $157.39 in 1908, and purchasing power of $7.16 in 2008!!!

What people don't realize is this hidden inflation changes, or secretly alters, the view of all economics. When people look at stock charts for example, typically it is viewed from an absolute view, when in reality, all stock charts should be adjusted for inflation. This is why I quote the S&P 500 valued in terms of Gold, to help give a different perspective on US stock market valuation in more absolute terms. Gold is an object that has value across all world currencies and other physical assets in a more neutral view than US dollars. By no way is this the perfect way to compute value, but it is more accurate than US dollars over the last 10 years.

In summary, inflation allows to skew, or mis-represent data in terms of money over time.

Next is skewing economic data measurements.
After the last Great Depression, some of the reforms that came out of that period was to have the US government act as a neutral party to present data on the economy so all investors could make decisions on a more level playing field.

There are 100's of metrics that grew out of the government for measuring the economy including unemployment, monetary base, Gross Domestic Product (GDP), import/exports, inflation, etc.

All of these metrics where semi-straight forward when created. For example, if you where once employed, and you became unemployed, you where counted as....unemployed. But now there are dozens of sub-categorization of what is unemployed. For example, if you are unemployed for a long duration, you are re-categorized as no longer in the work force. If you are receiving unemployment checks beyond the normal duration, but are in the "emergency extended benefits" category, you are no longer considered receiving unemployment benefits.

I can go on and on. But there is something very nefarious about changing what it means to be unemployed. The history books showing the percent of Americans unemployed in 1982, or 1935, are NOT adjusted using the latest metrics. The result is you will have people look at the history of unemployment numbers and make statements like "US is at 10% unemployment, not seen since 1982".
When in reality, if in 1982 the same methodology used today was used in 1982, perhaps unemployment then would be 8%, not 10%, and therefore you may need to go back to 1930 with the adjusted methodology to find a time matching today's experiences.

Changing of metrics, without retro-changing the history of previously published data, is a severe distortion of reality. This is yet another way to mis-represent the reality of the economy to put the individual investor at a disadvantage.

This is an issue on all levels of critical metrics the US government publishes. One particularly disturbing skewing of reality is on measuring inflation. By mis-measuring inflation, all inflation adjusted metrics are also skewed, distorting even trying to determine what 1 US dollar is worth today as compared to 10 years ago. This has deep distortion effects across all measurements of value and wealth over time.

And when a metric cannot be skewed, or distorted, the solution has been to eliminate the measurement. For example, the Federal Reserve Bank on 10 November 2005 announced that as of 23 March 2006, it would cease publication of a money supply metric called M3. (ShadowStats continues to try to estimate M3) This was deemed as no longer needed metric. If you click on the shadow stats link, notice M3 exploded right after reporting it stopped. I am sure that is just a coincidence.

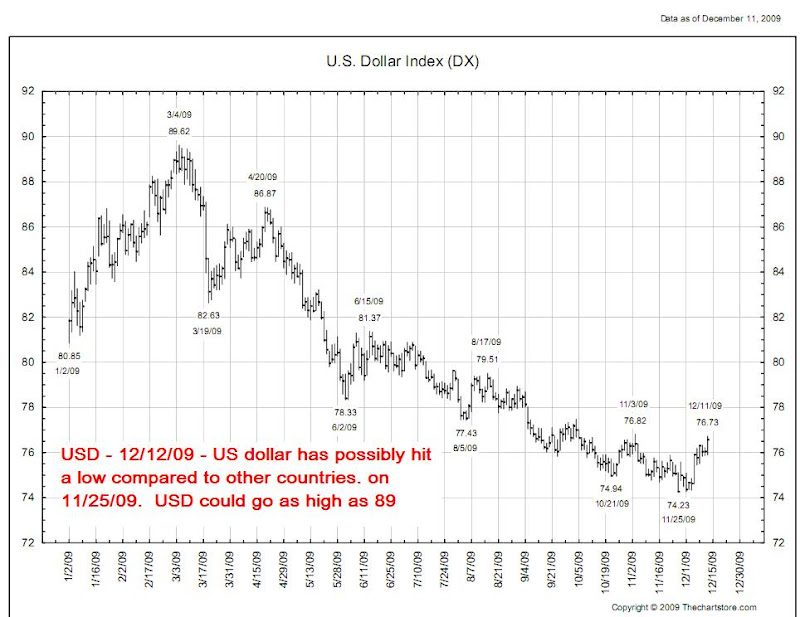
Bloggers have pieced together true inflation together with M3 from other data to yield reported inflation from true inflation. Currently as of 12/15/09, inflation reported is about 2%, when real inflation is about 7%. So if your savings is not yielding over 7%, your savings is in effect losing value in terms of US dollar. And this DOESN'T include the fact the US dollar plunged from 90 to 74 in 2009, a 17% drop in terms of world valuation. (US dollar currently rising, back to 77ish)

Inflation not being reflected in economic data, changing of economic metrics without retro changing past data, dropping reported data such as M3 monetary policy, currency devaluation, all have the effect of misrepresenting reality and putting the common investor at a disadvantage.

Please keep in mind, this was not a significant problem 40 years ago, all of this has been a continual morphing of the US government to skewing data to hide the reality of the economic data. In effect each political administration contributes to the distortion so on their watch, the claim can be made that the economy is better than the reality. I am not a conspiracy nut, there is no world order behind this distortion. What is at hand here is human nature, easier to "cheat" by changing the grade on a report card, than buckle down and study harder.

Unfortunately, the decades of accumulation of these changes has yielded much of the reported data so skewed, its hard to judge where the economy, and value of savings, stands.

In Summary
  • Fiat Currencies as they change in value over time, are not reflected in most economic historical data, like stock charts. Not auto-adjusting all economic data based on inflation distorts economic information.
  • Inflation itself is distorted, which in effect makes it even harder to actually compare financial and economic data over time in more absolute terms.
  • All other metrics of economic data are also changed over time, without retro-changing past values to put proper perspective on data.
  • All of these distortions create an environment where stored wealth is near impossible to assess if keeping up with devaluation over time, and a view of economic health to make informed decisions on money allocation.
  • These distortions are not a reflection of a world conspiracy, but a reflection on human nature to change the test, rather than work harder to have a better grade.

Tuesday, December 15, 2009

Predicting 2010 stock market

I'll be reviewing my 2009 predictions in a few weeks, to keep my scorecard honest.
Then, of course, a 2010 prediction to see how I do next year.

In the mean time, here's a poll to see where your fellow readers fall in their optimism/pessimism scale.

Sunday, December 13, 2009

Reader Poll

Recently, I ran across a web site called "micropoll" which lets you setup a reader poll easily. So, for the heck of it, here is my attempt.

Please take the time to answer, my readership bounces between 50 and 100, depending I believe on how violent the market is. Lets see if a Dozen answer. If I get a good response, I may have more interesting poll

Friday, December 11, 2009

Extreme Day

I find today to be an extremely over-extended up day. I am adding shorts, holding what I have, and waiting for the hyper-extension up to end with a snap.

But then again, I have thought that for a bit, good luck.

High Risk, High reward plays that I am involved with.
DECK at short 100, FAZ buy at 20.40, SRS buy at 8.30, TZA at 11.30, DXD at 29.55, short BAP at 74.50, short AMZN at 135,
Look at anything that went parabolic up since March without fundamentals for opportunity.

Thursday, December 10, 2009

State of New Jersey is screwed

I remember in high school being told one of the better things about New Jersey is it's bonds where AAA, and debt low. New Jersey has a high per capita income on average compared to other states. Plenty of corporate headquarters are in New Jersey.

I knew New Jersey had strayed and was piling on the debt, but I didn't realize how much.

New Jersey has $36.5 billion of gross tax-supported debt.
New Jersey has a population of 8,682,661.
That is $4,203 for every person in New Jersey, employed or not.

Compared to California
California has $75.2 billion of gross tax-supported debt.
California has a population of 36,756,666.
That is $2,045 for every person in California, employed or not.

Considering that California's economy dwarfs NJ, this is a little disturbing. What really disturbs me is if this economic downturn lasts through 2012, as I expect, NJ's options will be limited due to the debt burden it has already created.

To read more, see Mish's Blog post "Coming Collapse of Municipal Bonds; States, Cities Dig Deeper Holes"

Wednesday, December 9, 2009

Job situation being mis-represented

There are two great posts by Mish on the US Job situation. There are two major distortions of reality being perpetuated on the Public.

First there is the unemployment report distortions as discussed in post "Are you unemployed"?. What is considered to be unemployed is frankly, not "honest" assessment of the job situation. Further, when Jobless rates are quoted compared to the past, the past methodology was more honest than today. So 10% in 2009 is not the same 10% in 1992.

When you account for people who's benefits run out, took part time work but want full time employment, etc, its closer to 17%.

Second, the future projections on job creation is an outright ridiculous fantasy being presented by the US government. Some stats
  • At height of internet bubble, monthly new jobs rose to 264k.
  • At height of the 2005 real estate bubble, new jobs rose to 212k per month
  • The Feds forecast calls for 260k new jobs per month for the next 3 years to achieve 6% unemployment by end of 2012.
260k new jobs per month? I may be pessimistic at times, but come on, who believes this stuff? The public does, since the news headlines read "fed predicts 6% unemployment by 2012". The press doesn't dig beyond the headline, so the only place you can find sanity is on the internet. (and plenty of insanity, hence this blog).

To read more on the simple facts, and a more realistic forecast, see Mish's article titled "Fed's Unemployment Projections From Mars".

I added a new tag for posts that cover "RealityDistortions" to help document the ridiculous lies being fed to the public.

Tuesday, December 8, 2009

USD Making a comeback

US dollar is making a comeback, the question is, can equities levitate?

US Dollar chart for the last 6 months, the dead dollar may be rising again. As a US citizen, I am happy if this trend continues, my life savings is more secure. But any long equity investments are in jeopardy.

Natural resource plays, such as gold, are also in jeopardy, hence my exiting a week or so back.

From WebSufinMurfs FinancialBlog2

Where should long term investors invest?

The topic comes up frequently of where for retirees, long term savers, or just extra savings regardless of time horizon, put cash for safe storage and growth?

The number one real answer is, seek a certified financial adviser, I am not qualified.
With that out of the way, here is my opinion :)

The vast majority of savings should be in short-term low-yield US Treasury backed funds. Not state, not 30 year bonds, basically keep liquid.

The goal is to roll the cash into a longer term savings. But not now. US stock market is super-extended due for a correction. The US has done minimal reform, it has papered over its problems. The good news is, so has most of the world, making the US "not that bad" as being judged by it's peers.

Gold/Oil/Food/Resources? The time to load up was November of 2008. If equities pullback, as I expect it, they should deflate too.

The real question is, what is the next BUBBLE? 2000 was tech, 2008, was real estate, next up is resources (either just peaked or about to peak), the final end all bubble is US treasuries.

There is really 4 places to look to move from cash to investments. All of them require PATIENCE.

1) US international corporations - If/when the markets fall significantly, when prices look cheap again, us companies with international exposure should fare better in the next 10 years.
2) Natural resource companies - Right now, my opinion is with the market they pull back, but buying some natural resource based companies "on the cheap" to help hedge against a dollar fall . Alternately could put money into a currency you have more faith in, like Chinese yaun. (not sure if wise)
3) US Treasuries - if the day comes where US treasury interest rates go higher and higher, then one day, the treasuries change direction, perhaps after the Fed raises rates it starts to lower, 30 year treasuries to "lock in" the higher interest rates. Right now the rates are at lows compared to the last 20 years.
4) Emerging countries - once again, emerging countries are not valued cheaply. All the world markets have risen due to loose monetary standards. One day when it looks like the worst time ever to buy stocks, buy a little of emerging country index funds. India, China, are decent starts.

By investing when the next collapse occurs, or when one pops, your buing on the cheap. Right now, nothing is cheap. Make a plan and stick to it. Diversify when the sector is depressed.

Good luck, and don't put all investments in US cash and/or US stocks. Diversify into resource based funds, international corporations, and emerging markets. Thats a plan for the next 10 years.

Near term stock pricing
Slope of hope has excellent chart support/resistance lines, one dating back to 1932!
Gary's two cents on US dollar hitting a bottom and reversing.

Monday, December 7, 2009

S and P 500 price levels to watch

Some arm-chair basic price levels. When the market goes lower (sometime in the next 6 months....) these are the price levels to watch from the recent chart pattern.

If the market retreats, I am not so sure we will see any major down correction, probably the slow bleed/wiggle down. I am guessing the over-night surprises will be up, not down, to try to keep bears off their positions. But who knows, SPX 1152 before 1050 is possible.

From WebSufinMurfs FinancialBlog2