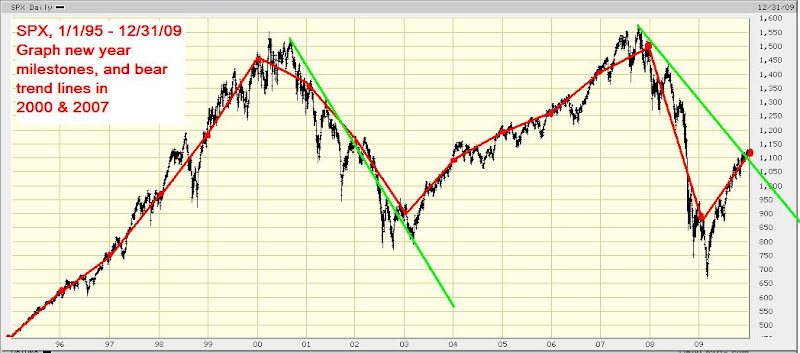
Today's post is 2009, with various charts showing 2009 in context of the last 2 to 14 years (depending on stock)
In general, pay special attention to the US 30 year treasury rates, this is a hint of what is to come.
 |
| From WebSufinMurfs FinancialBlog2 |
 |
| From WebSufinMurfs FinancialBlog2 |
 |
| From WebSufinMurfs FinancialBlog2 |
 |
| From WebSufinMurfs FinancialBlog2 |
 |
| From WebSufinMurfs FinancialBlog2 |
 |
| From WebSufinMurfs FinancialBlog2 |
 |
| From WebSufinMurfs FinancialBlog2 |
 |
| From WebSufinMurfs FinancialBlog2 |
No comments:
Post a Comment