I have been voicing my concern recently of a market top, which should have significant downside after such a violent market move up. (40% in 8 weeks).
When this market turns, which may have been today, its going to get ugly, fast.
I wanted to take a moment to ensure I am clear about most bear market traders like myself. We do NOT want the stock market to crash. People's 401K's that have become 201K's become 101K's is a crime, that deserves mass prosecution of the perpetrators of this offense. When I describe reasons to short a stock, or buy gold miners, it isn't out of some sort of perverse need or desire to see the US economy to fall apart.
Most bear market traders are people who read, think, and form opinions on what the actions being taken today will produce in the future. I cannot in good faith for my family or my friends and family buy general stock funds on the hope that huge deficit spending by the US government will produce years of prosperity.
I cannot buy stocks in the banking system, when the US Government will not enforce the law, and will not fix accounting rules that allow banks to obscure the companies value.
I will not advise buying US Treasuries as a long term investment, when the same government has outright stated their goal is to create an inflationary environment. But only a little one, that is controlled, and will be defused when needed. The US government has not yet once announced a plan that has gone according to plan. Communism does not work, free markets do. And the US Government trying to control a free market 1/2 way does not work. If we want to go full communist, lets get it over with and set the prices for everything.
I cannot buy a company like DIN, which it's stock price went parabolic up, over 700% in 7 weeks. This from a company that depends on disposable income where over 6.6 Million people are on continuing unemployment, with another 500K+ new unemployed being added monthly.
To me, the greatest exercise of free speech is the ability for the individual to be able to spend their money on buying food, clothing, shelter, give(donate), and investment as they see fit. As an investor there is always two sides of an argument, the value of the investment will rise or will fall.
A FREE society allows an individual to "bet" on either side. A non-free society, like China, disallows shorting. The US was the same way at one point, but discovered market dislocations occur when everyone must bet on the same side. Most bear market traders are also bull market traders, but "switch sides" once the reality shows the direction of the market trend.
The blogs I read, such at TheMarketTicker, Mish's Global Economic Trend Analysis, TheSmartMoneyTracker, TheBullzAndTheBearz, often take a critical eye to current news, stock trends, and market direction. The information digested on these blogs provide me with a perspective I do not get from the "free media". We live in a fantastic world where the likes of these bloggers can share and digest information with everyone in the world, for next to free! 20 years ago, this current situation would not allow me to get more accurate information than what was crafted for me by the government or corporations.
Further, people like KArl of the MarketTicker are actively creating political movements to reverse the market downslide. See FedUpUsa.org
So as a Bear Market trader, and blogger, I spend my time to articulate to you the reader so I can hopefully help you to safeguard your family's financial security. To inspire you to be more alert to the realities of what is occurring, to help influence political change. And for some other readers, to possibly give ideas of investments in either short term or long term.
I anticipate a blog post "in days" that depicts a very large bear announcing decisively the bear market has arrived, and be prepared for a ride down into the abyss.
I do not take joy in the announcement, but I am prepared for it. Are you?
Friday, May 22, 2009


Thursday, May 21, 2009
Gold Miners
 In reflecting on this blog, I realized that I talk quite a lot on current plays, but not on my primary play for the next 2-4 years.
I mention it time and time again, buy resource stocks, but I prefer Gold Miners, often linking to previous articles such as these (click).
What I haven't done is clearly articulate how committed I am to these gold miners, and the ROI I expect.
The gold miners from my initial recommendation price have a potential of 1,000%, some small ones maybe 10,000% return in the next few years. Yes, you read that right. How can I have such crazy thoughts?
The world is printing money, basically "photocopying" currency. They really aren't photocopying, there is a complex debt system keeping tabs on all the new money. But in the end this "resource" is being increased substantially world wide, in an effort to counter the massive DECREASE in credit. Credit in it's own way is another form of creating currency. This is especially true of the most common banking system, the fractional reserve banking system.
There are several things that will make resources in general explode. One, the "Ratio" of currency per unit of natural resource will go up, due to all the new cash. After all, cash is being created out of thin air, at an arbitrary human rate. Where natural resources have constraints on production.
Another is when the world gets out of this financial funk, there is 1.3 BILLION people in China, over 1 BILLION in India, and only 300 million on the USA. The USA has historically consumed significantly more of the world resources per citizen. Click for Oil. India loves gold.
This piggish ratio cannot last, now that China, India, Brazil, and lesser degree Russia (BRIC) have woken up. So how can the USA use less of the worlds resources, while other countries start consuming more as a %? Will the USA just decide to go on a resource diet to allow other countries to take a greater share of resources?
Hardly. The USA is not a good sharing nation when it comes to consumption. Therefore, there is one way this will occur, cost of resources. If the cost of resources RELATIVE to a USA citizen goes up, the US buys less resources, leaving more resources for other nations. Further, even if the USA tries to keep up consumption rates it has enjoyed, BRIC will bid up resource costs.
Why I like gold/silver/precious metals over other resources is a bonus value it has. The above two reasons articulate two primary reasons form a general standpoint why I like natural resources. Why specific precious metals has to do with one thing: Panic.
The world is in flux, and I believe what we are witnessing is the world killing off it's love affair with the US dollar, and moving to a new currency and new economic leader. The new currency is unknown still, China may be it. China has some severe problems, specifically the world being able to trust a communist nation with the worlds wealth. China I believe will be the new economic leader, driving the world economy as WE service their 1.3 billion people. I'm talking decades folks, not next week.
Aside from the currency standard changing, we also have potential for panic of world financial doom that sets people into a frantic migration to something that they can trust to store wealth. For most of human history precious metals such as gold has been looked at as "absolute" transportable wealth. (Land is absolute wealth, but not transportable, and land is taxed, gold isn't until sold)
Looking at my previous article on resources, I made a case on how resources are still cheap historically. Each day that passes resources are becoming more expensive. See Forbes article.
So, without further chatter, here are the gold miners, from their recommendation purchase date(s) to current valuations. I still hold these and plan to hold them all until gold hits 2000 to 4000 an ounce, or if/when gold prices go parabolic as it did in 1980, or as oil did in summer of 2008. At that time, I would like to sell gold and buy land or another resource.
ALL of these stock plays assume you are LONG the stock. Click on stock symbol for link of recommendation.
| Stock | 10/22/08 | 5/20/09 | Percent Gain |
| GDX | 19.50 | 40.47 | 107.5% |
| NAK | 2.00 | 7.7 | 285% |
| Stock | 10/27/08 | 5/20/09 | Percent Gain |
| AAUK | 9.13 | 12.47 | 36.6% |
| ABX | 18.14 | 36.22 | 99.7% |
| AUY | 3.74 | 10.00 | 167.4% |
| FCX | 23.75 | 10.00 | 110% |
| GG | 15.06 | 36.73 | 144% |
| GSS | 0.73 | 2.02 | 176.7% |
| HMY | 6.16 | 10.76 | 74.7% |
| IAG | 2.47 | 10.16 | 311.3% |
| NEM | 21.54 | 45.55 | 111.5% |
| PAAS | 9.6 | 20.99 | 118.6% |
| RGLD | 23.15 | 42.77 | 84.8% |
| Stock | 12/16/08 | 5/20/09 | Percent Gain |
| FNARX | 19.16 | 23.43 | 22.3% |
| IVN | 2.43 | 5.83 | 139.9% |
| NXG | 0.93 | 1.97 | 111.8% |
I HIGHLY recommend spending the money and paying for Gary's "Smart Money Tracker" blog for true insight and expertise on precious metal miners and other resources. Don't listen to me about how great gold miners are as an investment, listen to Gary. After all opinion you pay for is worth than my free one.
Also as always, I can't take the credit for most of these stock picks, John Chinnock is the true brains of this blogs operation.
NOTE: I have since dropped AAUK, mainly since I didn't want to be tied to a company with ties to England, since the pound probably will fall worse than the US dollar. Any future follow ups, I will keep AAUK on, but I am not an owner of the stock, nor do I recommend it.
Also FNARX I have no love for, it happens to be a natural resource ETF offered by Fidelity Investments, my broker. I bought it as a low risk diversification. Notice Low risk equals low returns.
The Bull keeps trying
I am starting to convince myself we will see the SPX hit the 200 DMA. But who knows, people could start buying seeing another rally that just doesn't materialize.
In any event, I am NOT adding to my shorts here. There will be plenty of time to do that when the market rolls over. What is driving this market up? One possibility is natural resource stocks, they are soaring, GDX hit over $40 a share today! Gold miners are on FIRE! See The Smart Money tracker for his comments on gold miners. Oil is doing great too, as well as food. (RJA ETF) At some point however, the rest of the stocks can't do well with rising costs (resources).
Even though the market is down, don't count this bull out yet! Not until time passes by the intersection of 2009 high, 200 DMA trend line, and bull trend line.
In any event, I am NOT adding to my shorts here. There will be plenty of time to do that when the market rolls over. What is driving this market up? One possibility is natural resource stocks, they are soaring, GDX hit over $40 a share today! Gold miners are on FIRE! See The Smart Money tracker for his comments on gold miners. Oil is doing great too, as well as food. (RJA ETF) At some point however, the rest of the stocks can't do well with rising costs (resources).
Even though the market is down, don't count this bull out yet! Not until time passes by the intersection of 2009 high, 200 DMA trend line, and bull trend line.
 |
| From WebSurfinMurf's Financial Blog |
Wednesday, May 20, 2009
Bull vs Bear
I have fixated on watching the "exact top" of the US Stock market in the near future. With a potential 200+ SP500 move down, with possible SP500 move up of about 50, the risk to reward is to get short, not long.
With that said, we are still in the same situation. On Wednesday of last week, the market finally broke the bull run trend. However on Monday the bull market came back with a vengeance routing late to the market bears.
At the end of today, the bull trend line up is now "resistance", the market bounced off the bull trend line today. I am still concerned now through next Tuesday of the market rallying up to the 200 Daily Moving Average (DMA) line.
So if your in on shorts, or lottery tickets, I would advise caution on adding to these positions. Better to be late to the party than get yet another run against the position before the market breaks.
As a quick check, lets see how bad the short plays are now.
ALL of these stock plays assume you short the stock.
All things considered, really not hurt that bad being short a market, after such a huge move up yesterday. DECK has really started to collapse, which is encouraging. In such a strong market, it has fallen. Very interesting. Wonder what will happen to DECK if the market falls.....
Also WYNN my big loser, is getting a little better. I won't even bother covering the lottery tickets, safe to say, they are a disaster currently. I'll post an update on them when we hit 200 DMA OR collapse. Until then they are very high risk positions as previously stated.
With that said, we are still in the same situation. On Wednesday of last week, the market finally broke the bull run trend. However on Monday the bull market came back with a vengeance routing late to the market bears.
At the end of today, the bull trend line up is now "resistance", the market bounced off the bull trend line today. I am still concerned now through next Tuesday of the market rallying up to the 200 Daily Moving Average (DMA) line.
 |
From WebSurfinMurf's Financial Blog |
So if your in on shorts, or lottery tickets, I would advise caution on adding to these positions. Better to be late to the party than get yet another run against the position before the market breaks.
As a quick check, lets see how bad the short plays are now.
ALL of these stock plays assume you short the stock.
| Stock | 4/16/9 | 5/19/09 | Percent Gain |
| AAPL | 121.45 | 127.45 | -4.9% |
| BAP | 50.01 | 53.82 | -7.6% |
| BBY | 38.53 | 37.25 | 3.3% |
| EAT | 18.78 | 17.55 | 6.5% |
| DEE | 82.72 | 71.25 | 13.9% |
| DECK | 62.33 | 49.79 | 20.1% |
| WYNN | 33.47 | 40.05 | -19.7% |
| new entries | 4-24-09 | 5/19/09 | ---- |
| DRI | 39.66 | 35.34 | 10.9% |
| new entries | 4-29-09 | 5/19/09 | ---- |
| DIN | 30.09 | 28.40 | 5.6% |
| CAKE | 17.65 | 16.09 | 8.8% |
| BWLD | 40.60 | 35.84 | 11.7% |
All things considered, really not hurt that bad being short a market, after such a huge move up yesterday. DECK has really started to collapse, which is encouraging. In such a strong market, it has fallen. Very interesting. Wonder what will happen to DECK if the market falls.....
Also WYNN my big loser, is getting a little better. I won't even bother covering the lottery tickets, safe to say, they are a disaster currently. I'll post an update on them when we hit 200 DMA OR collapse. Until then they are very high risk positions as previously stated.
Tuesday, May 19, 2009
Quick Thoughts
I didn't have time to do a more in-depth post. Just a few thoughts.
Corporate profits have hit the greatest decline EVER.
Stock price to earnings ratio is highest ever or just a little high, depending on assumptions. (See last post)
Bank valuations are still unknown, and other financial companies, due to not using mark to market valuation.
Credit faults are on rise.
Unemployment numbers increase by 500,000 per month.
China/Brazil making noise to decouple from US Dollar.
Market moved up due to India market ROCKETED higher, due to politics, not economics.
Coupled with pontification Sunday night expect a rebound (whoa, that was some rebound!), this move isn't out of total expectations. SPX target high is "here", 930, or 950. In any event we will see SPX 700 before 1000 in my opinion. Therefore the risk is going long here.
Good luck in any event, and please see Monday's post about stop losses. If you put them on FAZ, you where hit out on Monday. Up to you when/if to get back in.
My plan is to hold, and the day I'm ready to puke that I can't believe the level my lottery tickets fell to, to buy 2x.
Corporate profits have hit the greatest decline EVER.
Stock price to earnings ratio is highest ever or just a little high, depending on assumptions. (See last post)
Bank valuations are still unknown, and other financial companies, due to not using mark to market valuation.
Credit faults are on rise.
Unemployment numbers increase by 500,000 per month.
China/Brazil making noise to decouple from US Dollar.
Market moved up due to India market ROCKETED higher, due to politics, not economics.
Coupled with pontification Sunday night expect a rebound (whoa, that was some rebound!), this move isn't out of total expectations. SPX target high is "here", 930, or 950. In any event we will see SPX 700 before 1000 in my opinion. Therefore the risk is going long here.
Good luck in any event, and please see Monday's post about stop losses. If you put them on FAZ, you where hit out on Monday. Up to you when/if to get back in.
My plan is to hold, and the day I'm ready to puke that I can't believe the level my lottery tickets fell to, to buy 2x.
Monday, May 18, 2009
TheChartStore - Week two
UPDATE: 7:12pm - fixed second chart
Ron at the Chart store by now has to have a dart board with my name on it. I have pestered this guy for two weeks on reprinting some of his charts from his pay-for-view blog. Again, so far, Ron's charts aren't helping me pick stocks, but definitely is giving me perspective of the over-all market and sectors.
Rons blog this week has over 42 charts highlighted out of his 5,000 charts. Many of the 42 charts look tailor made for the weekly blog entry.
One of his charts shows the S&P500 Price/earnings ratio of stocks. Depending on assumptions, WORST case is depicted on the graph below. Best case puts Price/Earnings at 24.75x, which historically is not a "cheap" level for stocks. The take away , at the current US Stock market valuation, stocks are NOT cheap, and at worst case deserve to be easily 1/2 their current value.
Related to above chart is historical level of earnings report for S&P500. Extrapolating 2009 yields later in the year first time negative earnings for S&P500. Again, this isn't to say the extrapolation is right, but it does show that US Stocks are NOT cheap at this level.
Translation: Stocks SHOULD go lower.
So once again, I am touting The Chart Store service with the blog option. I get no commission, just sharing some of Ron's work.
Ron at the Chart store by now has to have a dart board with my name on it. I have pestered this guy for two weeks on reprinting some of his charts from his pay-for-view blog. Again, so far, Ron's charts aren't helping me pick stocks, but definitely is giving me perspective of the over-all market and sectors.
Rons blog this week has over 42 charts highlighted out of his 5,000 charts. Many of the 42 charts look tailor made for the weekly blog entry.
One of his charts shows the S&P500 Price/earnings ratio of stocks. Depending on assumptions, WORST case is depicted on the graph below. Best case puts Price/Earnings at 24.75x, which historically is not a "cheap" level for stocks. The take away , at the current US Stock market valuation, stocks are NOT cheap, and at worst case deserve to be easily 1/2 their current value.
 |
| From WebSurfinMurf's Financial Blog |
Related to above chart is historical level of earnings report for S&P500. Extrapolating 2009 yields later in the year first time negative earnings for S&P500. Again, this isn't to say the extrapolation is right, but it does show that US Stocks are NOT cheap at this level.
Translation: Stocks SHOULD go lower.
 |
| From WebSurfinMurf's Financial Blog |
So once again, I am touting The Chart Store service with the blog option. I get no commission, just sharing some of Ron's work.
Has the bear won?
 |
| From WebSurfinMurf's Financial Blog |
I really wanted to create a post stating the Bear market is here, watch out! I am betting this is the case, and we are going lower from 5-8-09 highs.
Last week broke the bull week over week gain for the last 9 weeks. My only hesitation with all this bearish talk is the graph below. The 200 DMA, 2009 high, and the bull trend line up all converge this Friday or following Monday. I could see the market rallying to this point again THEN the market falls apart.
 So although the Bear has broken the Bull run this past week, one week doesn't make a trend change. Unfortunately when trying to establish a bear position in a bear market rally, there never seems to be a good time. I already picked my timing, from about 5-8-09.
My friend John Chinnock makes a great point for the bear market, do you think the market will be "kind" enough to rally to allow the bulls caught buying at 5-8-9 highs to sell? The market does tend to "take" money from those who stayed too long in the game, and any bull in the market after a 40% upswing in 9 weeks deserves to get pinched.
But if the market makes one more shot up before collapsing, the lottery tickets should get hurt very badly. I'm hoping the established shorts will not make any significant gains, due to their charts already looking over-extended up.
Gold has been doing fantastic. This translates into pretty good move upward for gold miners, including GDX. My gold miner positions where established long ago, and I'm not selling a single one for years.
 NONE of this bull/bear talk changes the next 4 week outlook for the markets, which is down from these levels. So if the bulls get one more push up, try to minimize any panic moves before the bear trend resumes. Establish stops now, when your head is clear to avoid an emotional reaction to a rally.
Sunday, May 17, 2009
Lottery Tickets 2 Eight Days Later
 As previously mentioned, the second Lottery Tickets are MUCH higher risk. So these lottery tickets aren't for the feint of heart.
Lets take a look how we did 8 days later.
| Stock | 5/7/9 | 5/15/09 | Percent Gain |
| FAZ | 4.75 | 5.90 | 24% |
| SRS | 20.15 | 24.46 | 21.5% |
| TZA | 24.95 | 30.03 | 20.4% |
As impressive as these returns are, all these stocks could easily go negative on return in two days. I'll be impressed if we can make it to next weekend with higher returns than 20-25% per stock next week. It isn't a bad idea with these gains made, to put stop-losses in at the entry points I listed above, to ensure you don't lose your shirt if I am wrong.
If your a high roller, sell 50% at 100% return, and let the rest ride. Tempted to gamble sell 50-75% of the stock at 50% up. Or plain crazy, keep it all until it seems like your shocked how low the market ran. I'm in the last group, mainly since we saw a 40% rally in 9 weeks should mean a decent pullback.
It isn't too far fetched to see SRS hit at 75, FAZ 12 to 20 (Depends on velocity of market movement), and TZA I'll get nervous over 50 bucks. All could hit MUCH higher numbers if the market is headed to new lows, which is a very real possibility. I reserve the right to get cold feet at any moment and dump all. :)
Still, the best bet was the short pays already mentioned here.
A special thanks to Happy John, who gave me the confidence to bet larger on these plays than I normally would for Lottery Ticket plays. Happy John is a fiscally conservative person, and he placed some of the largest bets (considering the risk) than I have known him to do in the last 3 years.
Saturday, May 16, 2009
Saturday Video Post 11
This is a fun video about the exponential nature of the world we live in.
A must watch to get a sense of how the world is changing.
While watching think of the impact this will have on the valuation of natural resources in the next 20+ years. Natural resource DEMAND can go exponential, but the supply cannot. CLICK HERE to watch without annoying pop up ads.
If there is a WW 3, it will be over natural resources , the one thing everyone can't seem to share equally, least the USA. :(
A must watch to get a sense of how the world is changing.
While watching think of the impact this will have on the valuation of natural resources in the next 20+ years. Natural resource DEMAND can go exponential, but the supply cannot. CLICK HERE to watch without annoying pop up ads.
If there is a WW 3, it will be over natural resources , the one thing everyone can't seem to share equally, least the USA. :(
Friday, May 15, 2009
We can’t keep on just borrowing from China
The title of this blog entry is the quote of the day.
I am starting to wonder if Obama is basically a very smart person, a quick learner, but his problem is he has huge deficits of knowledge of some basic world mechanics, such as economics.
Assuming Obama is a quick learner, I am getting a little bit more optimistic here. What makes me think Obama is a quick learner. A quote from Obama today. (full article click here)
President Barack Obama, calling current deficit spending “unsustainable,” warned of skyrocketing interest rates for consumers if the U.S. continues to finance government by borrowing from other countries.
I have blogged this many times before. It is widely discussed that with huge debt, if interest rates rise, the nation's debt will consume any infrastructure and services spending. And we have arrived today at the President of the USA, just talking now that debt is not a highway to prosperity.
In the last 8 months HUGE debt by the US government was taken on, and even more HUGE debt in the form of back-stopping obligations by private companies. This has shown a pattern that will lead to the Doom and Gloom post.
But here we have Obama seems to "get it" when it comes to debt. What is now needed is ACTION!!! Enforce laws. Enforce budget caps. Improve business environment, by allowing capitalism to take its course. In general, clean up our act.
Hopefully Obama "Gets all of it" and ACTS ON IT, does what needs to be done sooner rather than in four years. I don't want my doom scenarios to become reality, it's up to us to ensure it doesn't, and that starts with our leader.
I am starting to wonder if Obama is basically a very smart person, a quick learner, but his problem is he has huge deficits of knowledge of some basic world mechanics, such as economics.
Assuming Obama is a quick learner, I am getting a little bit more optimistic here. What makes me think Obama is a quick learner. A quote from Obama today. (full article click here)
President Barack Obama, calling current deficit spending “unsustainable,” warned of skyrocketing interest rates for consumers if the U.S. continues to finance government by borrowing from other countries.
“We can’t keep on just borrowing from China,” Obama said at a town-hall meeting in Rio Rancho, New Mexico, outside Albuquerque. “We have to pay interest on that debt, and that means we are mortgaging our children’s future with more and more debt.”
Holders of U.S. debt will eventually “get tired” of buying it, causing interest rates on everything from auto loans to home mortgages to increase, Obama said. “It will have a dampening effect on our economy.”
The president pledged to work with Congress to shore up entitlement programs such as Social Security and Medicare and said he was confident that the House and Senate would pass health-care overhaul bills by August.
I am speechless. To me this was an obvious, easy spin on the reality of economics, that debt has consequences. And in general its not good to "require" additional debt daily to be successful. And if you never pay your debt, but increase it, the cost of borrowing more goes up.I have blogged this many times before. It is widely discussed that with huge debt, if interest rates rise, the nation's debt will consume any infrastructure and services spending. And we have arrived today at the President of the USA, just talking now that debt is not a highway to prosperity.
In the last 8 months HUGE debt by the US government was taken on, and even more HUGE debt in the form of back-stopping obligations by private companies. This has shown a pattern that will lead to the Doom and Gloom post.
But here we have Obama seems to "get it" when it comes to debt. What is now needed is ACTION!!! Enforce laws. Enforce budget caps. Improve business environment, by allowing capitalism to take its course. In general, clean up our act.
Hopefully Obama "Gets all of it" and ACTS ON IT, does what needs to be done sooner rather than in four years. I don't want my doom scenarios to become reality, it's up to us to ensure it doesn't, and that starts with our leader.
Thursday, May 14, 2009
Doom and Gloom
The news media and government have been spinning tails of what the future holds. All of them are rosy to "very mild problems". There is no indication at all of the possible problems we will face based upon possible mis-steps being taken today.
A good article on Seeking Alpha lists WORST CASE Scenario, well worth the read. (click) Of course true worst case is Mad-Max, but that to me is off the table, but fun to reference. :) I am not in the camp that the rosy scenario will occur, nor the worst case (yet), but somewhere in the middle, leaning slightly to worse case.
The one thing I do agree is lawlessness and corruption will seep its way into Americana, one of the great assets of America will be gone, trust. We have an example of actions being taken NOW will destroy that trust.
The government is setting precedence that the LAW does not matter when it comes to finance. The damage this will do in world confidence in the US is beyond calculation in terms of investment dollars lost. With the bankruptcy of GM, the government is changing the rules of who gets paid. Read more from Karl by clicking here:
A private watch group, Judicial Watch filed a Freedom of Information Act (FOIA) requested information about a federal bankers meeting on October 16, 2008. After months of stonewalling, a FOIA lawsuit was filed against the Obama Treasury Department on January 27, 2009. Incredibly, on February 4, Treasury responded it had no documents about the historic meeting. It was released today that the Treasury Department coerced major banks to allow the government to take $250 billion equity stakes.
And the government is taking a draconian approach by looking into regulating/dictating corporate compensation. The TRUE answer is to change the structure of the pay-out, it should be linked to not only past performance, but future company health. I have blogged about this before. But the government dictating what is appropriate pay? This is insanity.
As for the economic Rosy outlook? S&P states U.S. banking crisis may last until 2013
FINALLY! Some honesty, this is refreshing that the timeline is father out than "next quarter" for a turn around.
There is plenty to be doom and gloom about. There will be a bottom, the US will rebuild, and in a generation come back swinging. For now, what matters is where to invest, and its not in stock hoping to see DOW 14K in a couple of years.
REMEMBER, Options expiration is Saturday, expect some real game playing to go on. This bull won't die without a fierce fight. I expect government games to make a rocket ride up for the market. Probably something like announcing putting CDS on a regulated exchange, etc.
A good article on Seeking Alpha lists WORST CASE Scenario, well worth the read. (click) Of course true worst case is Mad-Max, but that to me is off the table, but fun to reference. :) I am not in the camp that the rosy scenario will occur, nor the worst case (yet), but somewhere in the middle, leaning slightly to worse case.
The one thing I do agree is lawlessness and corruption will seep its way into Americana, one of the great assets of America will be gone, trust. We have an example of actions being taken NOW will destroy that trust.
The government is setting precedence that the LAW does not matter when it comes to finance. The damage this will do in world confidence in the US is beyond calculation in terms of investment dollars lost. With the bankruptcy of GM, the government is changing the rules of who gets paid. Read more from Karl by clicking here:
A private watch group, Judicial Watch filed a Freedom of Information Act (FOIA) requested information about a federal bankers meeting on October 16, 2008. After months of stonewalling, a FOIA lawsuit was filed against the Obama Treasury Department on January 27, 2009. Incredibly, on February 4, Treasury responded it had no documents about the historic meeting. It was released today that the Treasury Department coerced major banks to allow the government to take $250 billion equity stakes.
And the government is taking a draconian approach by looking into regulating/dictating corporate compensation. The TRUE answer is to change the structure of the pay-out, it should be linked to not only past performance, but future company health. I have blogged about this before. But the government dictating what is appropriate pay? This is insanity.
As for the economic Rosy outlook? S&P states U.S. banking crisis may last until 2013
FINALLY! Some honesty, this is refreshing that the timeline is father out than "next quarter" for a turn around.
There is plenty to be doom and gloom about. There will be a bottom, the US will rebuild, and in a generation come back swinging. For now, what matters is where to invest, and its not in stock hoping to see DOW 14K in a couple of years.
REMEMBER, Options expiration is Saturday, expect some real game playing to go on. This bull won't die without a fierce fight. I expect government games to make a rocket ride up for the market. Probably something like announcing putting CDS on a regulated exchange, etc.
Wednesday, May 13, 2009
The Bull Market vs Bear Market
|
| From WebSurfinMurf's Financial Blog |
The bull is fighting the bear market, trying to keep its gains. I am in the camp that the bear will win fight in the next 7 business days. Lets take a look at what was happening with S&P 500.
Notice we are close to hitting the 200 DMA, as first mentioned as a target on this blog back on 3/4/09, and several times after that.
Remember, there is NO GUARANTEE we will hit the 200 DMA. It is quite possible the "Bear market" wins against the Bull Market rally before then and the market takes a nose dive. That is why I have been yelling from the rooftops if you where caught long from August 2008, to consider taking some investments off the table to lock in the gains of the last 9 weeks.
Lets look at the chart, and the trend line, notice we will have our answer in the next 7 business days.
 |
| From WebSurfinMurf's Financial Blog |
My problem is I gotta be in it to win it, and I got in ahead of this decision point getting short in a big way. But so far, the shorts are doing great in this bull market. Also gold miners are rallying quite well up. This may be a poker tell of what is to come. The over-extended stocks are starting to trend down, while fear is putting money into gold miners for safe keeping.
Lets look at the short plays from April 30th, 9 business days later. (Put mouse cursor over symbols for current prices/charts)
ALL of these stock plays assume you short the stock.
| Stock | 4/16/9 | 5/12/09 | Percent Gain |
| AAPL | 121.45 | 124.42 | -2.4% |
| BAP | 50.01 | 54.98 | -9.9% |
| BBY | 38.53 | 37.06 | 3.8% |
| EAT | 18.78 | 16.36 | 12.9% |
| DEE | 82.72 | 69.44 | 16.1% |
| DECK | 62.33 | 54.94 | 11.9% |
| WYNN | 33.47 | 45.18 | -35% |
| new entries | 4-24-09 | 5/12/09 | ---- |
| DRI | 39.66 | 34.89 | 12.0% |
| new entries | 4-29-09 | 5/12/09 | ---- |
| DIN | 30.09 | 26.37 | 12.4% |
| CAKE | 17.65 | 15.05 | 14.7% |
| BWLD | 40.60 | 35.58 | 12.4% |
With the exception of WYNN, the plays overall are doing pretty well, considering it has been a bull market for the last few weeks. As previously mentioned almost all trading ideas came from Happy John. At the TheBullzAndBearz.com, for 5 bucks a month, Kirk lays out the charts for most of these plays, and other plays. He also had a stop for Wynn, which if I had listened, would have cut my losses at about 10%. I can't recommend highly enough for 5 bucks a month to pay for Kirks service, even if just for the chart analysis.
I'll cover depending on each chart and/or when I think the market has over-all been extended too far down.
AAPL is looking like a GREAT short. I may buy more puts on it tomorrow. If WYNN pops up to 50, a great shorting opportunity.
NOTE! I fully expect one or two disaster days, where all of these shorts make a run up. After that however, I would expect a quick pull back down, perhaps even over-night. So I would prefer to be in it since the dates listed over trying to catch an exact top.
A quick look at GDX chart below. I was HUGE long GDX starting at 17, but lost my way at some point. I have only some GDX, but I still have tons of baby gold miners. In any event, I think I would need an announcement that gold can be made from lead to shake me from my current positions. As you can see, GDX @ 42 will be a critical line to cross.
It is possible that the gold miners form their own independent "bull market", and act differently from the rest of the market. Therefore even though my positions are doing absolutely fantastic. there is no way I take one share off the table. GDX target could pass 200 in the next few years, and I wouldn't rule out 1,000 if things go really really bad in the world.
 |
| From WebSurfinMurf's Financial Blog |
So there you have it a complete round up. I'll post an update on the Lottery Tickets Season two in the next few days. Good Luck. If you are thinking of joining some of these positions, and want "minimal risk", if the SPX does hit the 200 DMA, its a great entry point.
Tuesday, May 12, 2009
The Chart Store
 In my series to cover various good web sites for information, today I'll cover The Chart Store.
The chart store is new to me, and so I don't have any history for how the charts help me trade. The chart store has over 5,000 different charts, many dating back to before the 1930's. For information dating back that far, you would need to pay 1,000's per month for such a service.
As a huge plus, Ron of the Chart store puts together a weekly blog entry where he uses his vast arsenal of charts and highlights from his perspective, what is going on in the markets. This "premium" service is crucial, since who has the time to look at 5,000 charts weekly? :)
Ron gave me permission to print two charts from his blog entry for this past Sunday. You are allowed to quote his normal charts, not from his blog, if done sparingly and appropriately. Basically, don't abuse his site!
When I registered Ron called me out on printing a falsehood, that this recent rally wasn't the second greatest rally of all time. To the right is a list of the top greatest stock market rallies of all time. I'll correct my post, this past rally is the greatest rally of all time since the 30's, that has occurred in such a short period of time. Notice in the chart, I added the red circles highlighting each top rally that occurred under 75 days. Notice NONE occurred since the 30's except the current one.
The 30's involved the last Great Depression. This is NOT a good sign for this rally!
The caption for the chart states "The table has a listing of all S&P Composite swings up of greater than 10% without a corresponding down swing of at least 10% where the up swing was at least 30%. "
The second chart shows % of stocks in the S&P500 are over the 50 day moving average, notice that when % gets very high, the market usually declines afterwards. This last rise has been a very strong, with a significant bell curve shape in the current % of companies above 50 day moving average.
 |
| From WebSurfinMurf's Financial Blog |
The Chart Store blog entry highlighted about 45 charts, with notation, making it a quick breeze to review.
So click here to see the charts "the chart store" has to offer. (click orange bar for more charts) I particularly like the charts inflation adjusted, to give a more accurate view of natural resource valuation. See below for CRB (Commodity index) charts one without adjusting for PPI , the other with. Quite a different view of commodity valuation compared to history with PPI adjusted.
So Click here to see the cost to join. One trade can easily pay for the costs. Looking at these charts can give you the confidence to make a trade you normally wouldn't do, so how much is that worth?
 |
| From WebSurfinMurf's Financial Blog |
 |
| From WebSurfinMurf's Financial Blog |
Monday, May 11, 2009
Twitter Updates
I added a widget to the far right of this blog, that shows my Twitter updates in the form of RSS feeds.
I don't think that it updates "Real time". But its good enough to catch up on more detailed/pieces of information.
On Friday, I dumped almost all my oil longs. I have DXO left, and will likely dump that on Monday.
Also dumped many other longs, kept Gold.
I don't think that it updates "Real time". But its good enough to catch up on more detailed/pieces of information.
On Friday, I dumped almost all my oil longs. I have DXO left, and will likely dump that on Monday.
Also dumped many other longs, kept Gold.
Cost of Debt - Where the action is
The US Government has made it clear. It will issue unsurpassed amounts of debt in an attempt to "revitalize" the economy. The irony is, it should do the exact opposite. By the US Government needing to "sell large quantities of US Bonds", that financial instrument is "required" to be sold, and the government needs to get people to buy them.....hopefully with cheap interest rates.
If the government didn't have a burning need to sell bonds, because of deficit spending, it could offer low interest rates to bidders. If no one bought it, who cares!
But the Government has created a situation where it MUST sell debt, A LOT of debt, TRILLIONS of debt. So if people won't buy US 10 year treasury notes at 2.8%, what can the government do? It can pay more for the interest, to lure people to buying its debt, say, 2.9%, then 3.0, etc.
If the interest rates rise too high or too fast, then other competing debt vehicles rise, such as mortgages, business loans, credit cards, etc. If housing interest rates rises, then the housing crisis becomes more critical. More businesses fail since their debt costs over-take them, etc.
How can the government get people to buy their debt cheaper? Well, there is really only one legal way. And that is, if the market falls, fear rises, and people run to government debt as a safe haven. After all, a US bond is basically cash that pays interest.
Aside from the market rising very fast recently, to me indicating that the market should drop, the second issue is cost of US Debt. The government will have to make a choice, sometime between 3.3% and 5.5% that it must lower rates, or start a death spiral chain of rising interest rates, more failures, creating higher rates as credit risk/losses increase.
Unfortunately, for the government and all of us, once the market collapses to new lows, say DOW to 4,000, the government will lose the 'fear play" as an option. And THEN interest rates may rise uncontrollably. We all lose once the market is puttering around a final bottom AND cost of credit rises. Those McMansions will become cheaper than anyone's wildest dreams.
God I hope I am wrong.
Chart on Treasury 10 year notes
If the government didn't have a burning need to sell bonds, because of deficit spending, it could offer low interest rates to bidders. If no one bought it, who cares!
But the Government has created a situation where it MUST sell debt, A LOT of debt, TRILLIONS of debt. So if people won't buy US 10 year treasury notes at 2.8%, what can the government do? It can pay more for the interest, to lure people to buying its debt, say, 2.9%, then 3.0, etc.
If the interest rates rise too high or too fast, then other competing debt vehicles rise, such as mortgages, business loans, credit cards, etc. If housing interest rates rises, then the housing crisis becomes more critical. More businesses fail since their debt costs over-take them, etc.
How can the government get people to buy their debt cheaper? Well, there is really only one legal way. And that is, if the market falls, fear rises, and people run to government debt as a safe haven. After all, a US bond is basically cash that pays interest.
Aside from the market rising very fast recently, to me indicating that the market should drop, the second issue is cost of US Debt. The government will have to make a choice, sometime between 3.3% and 5.5% that it must lower rates, or start a death spiral chain of rising interest rates, more failures, creating higher rates as credit risk/losses increase.
Unfortunately, for the government and all of us, once the market collapses to new lows, say DOW to 4,000, the government will lose the 'fear play" as an option. And THEN interest rates may rise uncontrollably. We all lose once the market is puttering around a final bottom AND cost of credit rises. Those McMansions will become cheaper than anyone's wildest dreams.
God I hope I am wrong.
Chart on Treasury 10 year notes
 |
| From WebSurfinMurf's Financial Blog |
Sunday, May 10, 2009
Outlook for week of May 10th
I have blogged that the market is a bit over-extended on the rally upwards.
Also that the rally is "days to couple of weeks" before it rolls over.
I have been hyping "any day now". Now I'm starting to think it will be no later than 1 week from this Monday. Why? This Saturday the 16th is options expiration. And significant turns happen during options expiration weeks. I'll do a double post back to back also on what will make the government pull the trap door and hang all the people in equities.
For those of the readers invest by buying or selling once or twice a year, choosing the "exact top" to sell is foolish, anything starting now is excellent time to sell.
For those trying to catch a reversal, SCALE into the position, if/as we rally higher, you can add to your shorts or ETF's to catch a reversal.
Once this top hits, this may be THE TOP of the market for the next 5+ years. This is no-joke folks. If the market breaks the lower level established earlier this year, its pretty much game over for the market.
Unfortunately for me if/once the market goes to the next leg down, once the market hits the next low, whatever that is, I think the market volatility will be reduced. And investing on a day-week-month-quarter level is profitable when trading around significant volatility. So this may be the last hurray for "quick money" and we will enter the slow bleed up for resource based stocks.
Why do I call this market volatile? Lets look once again (I beat concepts into the ground until you don't want to read me anymore) at the S&P
S&P 500 is up 40% currently in 8 weeks. What we are looking at is a parabolic blow off of possibly up 50% in 9 weeks. From 4/03 to 4/07, the market went up 50% in 48 months.
50% up in 4 years is a BULL MARKET. That is what "normal" people invest in. The goal is to Buy low and sell high. Buying in 03 and selling in 07 is a good WIN.
Lets look at current market. Buying (or holding your losers) since 8 weeks ago to today, up 40% is a WIN. Lets assume we enter complete parabolic blow off, up 50% in 9 weeks.
Question is, why not sell? You are looking for 60% in 10 weeks? Also notice the chart in 01, and 02 market action. Doesn't those "Shapes" look more like what we are seeing now? Notice the market resumed its down trend.
Get the heck out of dodge before someone yells fire and there is a stampede for the door. IF you are greedy and believe we will see up 100% in the next few months, sell 25% of your investments (NON resource based). You'll be glad you did if I am right, and glad you didn't sell 100% if your right. But I am right. :)
(See disclaimer on me stating I am right, click here)
If your a gambler, like me, enter short positions, buy very very long term puts on market indexes (like 1-2 years out), buy higher risk ETF's on double inverse shorts, such as TZA, QID, and DXD.
See charts below.
There is no such thing as a free bailout, and the losses MUST occur. The government hand will be pushed to recognizing market decline.
Also that the rally is "days to couple of weeks" before it rolls over.
I have been hyping "any day now". Now I'm starting to think it will be no later than 1 week from this Monday. Why? This Saturday the 16th is options expiration. And significant turns happen during options expiration weeks. I'll do a double post back to back also on what will make the government pull the trap door and hang all the people in equities.
For those of the readers invest by buying or selling once or twice a year, choosing the "exact top" to sell is foolish, anything starting now is excellent time to sell.
For those trying to catch a reversal, SCALE into the position, if/as we rally higher, you can add to your shorts or ETF's to catch a reversal.
Once this top hits, this may be THE TOP of the market for the next 5+ years. This is no-joke folks. If the market breaks the lower level established earlier this year, its pretty much game over for the market.
Unfortunately for me if/once the market goes to the next leg down, once the market hits the next low, whatever that is, I think the market volatility will be reduced. And investing on a day-week-month-quarter level is profitable when trading around significant volatility. So this may be the last hurray for "quick money" and we will enter the slow bleed up for resource based stocks.
Why do I call this market volatile? Lets look once again (I beat concepts into the ground until you don't want to read me anymore) at the S&P
S&P 500 is up 40% currently in 8 weeks. What we are looking at is a parabolic blow off of possibly up 50% in 9 weeks. From 4/03 to 4/07, the market went up 50% in 48 months.
50% up in 4 years is a BULL MARKET. That is what "normal" people invest in. The goal is to Buy low and sell high. Buying in 03 and selling in 07 is a good WIN.
Lets look at current market. Buying (or holding your losers) since 8 weeks ago to today, up 40% is a WIN. Lets assume we enter complete parabolic blow off, up 50% in 9 weeks.
Question is, why not sell? You are looking for 60% in 10 weeks? Also notice the chart in 01, and 02 market action. Doesn't those "Shapes" look more like what we are seeing now? Notice the market resumed its down trend.
Get the heck out of dodge before someone yells fire and there is a stampede for the door. IF you are greedy and believe we will see up 100% in the next few months, sell 25% of your investments (NON resource based). You'll be glad you did if I am right, and glad you didn't sell 100% if your right. But I am right. :)
(See disclaimer on me stating I am right, click here)
If your a gambler, like me, enter short positions, buy very very long term puts on market indexes (like 1-2 years out), buy higher risk ETF's on double inverse shorts, such as TZA, QID, and DXD.
See charts below.
There is no such thing as a free bailout, and the losses MUST occur. The government hand will be pushed to recognizing market decline.
 |
| From WebSurfinMurf's Financial Blog |
 |
| From WebSurfinMurf's Financial Blog |
Saturday Video Post 10 ... On Sunday
Well, Saturday was a busy day working towards my family's first mothers day.
So here is Saturday's video.....on Sunday.
Instead of my normal slit-your-rists-the-world-is-doomed video, instead yet another comedy Hitler video on the current financial issues.
I posted a previous one about margin calls being called because the Fed changed shorting rules on financial companies. (that one got me too)
So here is Saturday's video.....on Sunday.
Instead of my normal slit-your-rists-the-world-is-doomed video, instead yet another comedy Hitler video on the current financial issues.
I posted a previous one about margin calls being called because the Fed changed shorting rules on financial companies. (that one got me too)
Friday, May 8, 2009
Freaky Friday
I expect Friday to be not fun.....for anyone.
Thursday after hours, Fed announced stress test results. Also banks announced more stock offerings to dilute their stock. MS, WFC, BOA, Citibank, are all making public offerings of debt, either as stock or as bonds.
Why? I'll ASSUME (no proof here) the Fed said either we announce you must raise XXX cash, or you can pre-empt us by announcing your raising cash.
In any event, its the same thing. So the "good news" is, the stress test didn't announce anything earth shattering. The bad news is, stock dilution for many banks. The stress test I am sure will be critiqued heavily for the next week. And I'm pretty sure the bloggers will basically state the stress test was garbage. And in a few months the government will have to look again what else can it do to generate faith in the banks. Of course making the banks properly mark the valuation of the debt obligations they hold is plain crazy talk! So some other game will be created to try to fool everyone that its all OK.
As for next few days. My post stands, I think we are near a top. I just don't expect any "top" to be easy, so some games will be played for a day or two.
I did say I would post EOD Thursday for my lottery tickets. If Friday these open UP big, it may be a great chance to still get in. If you want to buy 500 shares, buy 200. And buy up to 300 more if/as they fall more.
Point in, buying some high risk stock doesn't have to be all in at one time.
Prices as of Thursday 5/7/09 close prices
FAZ - 3x short financial markets - Price 4.75/5.67
SRS - Double short real estate - Price 20.15/23.16
TZA - 3x short Russell index - price 24.95/27.83
For more about the stress test, and other news, read Mish! (click) He is a real news, no spin, god. :)
Thursday after hours, Fed announced stress test results. Also banks announced more stock offerings to dilute their stock. MS, WFC, BOA, Citibank, are all making public offerings of debt, either as stock or as bonds.
Why? I'll ASSUME (no proof here) the Fed said either we announce you must raise XXX cash, or you can pre-empt us by announcing your raising cash.
In any event, its the same thing. So the "good news" is, the stress test didn't announce anything earth shattering. The bad news is, stock dilution for many banks. The stress test I am sure will be critiqued heavily for the next week. And I'm pretty sure the bloggers will basically state the stress test was garbage. And in a few months the government will have to look again what else can it do to generate faith in the banks. Of course making the banks properly mark the valuation of the debt obligations they hold is plain crazy talk! So some other game will be created to try to fool everyone that its all OK.
As for next few days. My post stands, I think we are near a top. I just don't expect any "top" to be easy, so some games will be played for a day or two.
I did say I would post EOD Thursday for my lottery tickets. If Friday these open UP big, it may be a great chance to still get in. If you want to buy 500 shares, buy 200. And buy up to 300 more if/as they fall more.
Point in, buying some high risk stock doesn't have to be all in at one time.
Prices as of Thursday 5/7/09 close prices
FAZ - 3x short financial markets - Price 4.75/5.67
SRS - Double short real estate - Price 20.15/23.16
TZA - 3x short Russell index - price 24.95/27.83
For more about the stress test, and other news, read Mish! (click) He is a real news, no spin, god. :)
Thursday, May 7, 2009
Lottery Tickets - Second Season
These are MUCH HIGHER risk than my last lottery tickets
My last ones was based on the principle not all the stocks I recommended would NOT go bankrupt, and therefore the stocks would rebound.
Turns out none went bankrupt and all rebounded. FAZ is high risk, but at 4.75, you can "place a bet" on 100 shares for $475.00. Put a stop at 235 to ensure you get 1/2 money back if it continues to free fall. Otherwise sell 50 at 9.5 a share, and let the rest ride.
Prices as of Thursday 5/7/09 open prices
FAZ - 3x short financial markets - Price 4.75
SRS - Double short real estate - Price 20.15
TZA - 3x short Russell index - price 24.95
I'll put closing prices also at EOD.
And the "sure play" (NOTHING is a sure play) is shorting the stocks already mentioned here.
And crazy high risk, for crack addict gamblers short my last lottery tickets, after all stocks like MGM went up 500% in 8 weeks!
Market Rally Continues for 8 weeks
Gold and resources have been exploding higher. The USA's food, energy, and materials (metals) are all going up in price. For this sector, this is moving up as expected, as I have ranted dozens of times. The longer term view of USA citizens eventually ending up with basic resources costing them more. Read here and here for more rants.
The S&P 500 is approaching the 200 DMA line, also predicted (Click here). The timeline for this happening is a bit sooner than expected. If your long in stocks, this is a GOLDEN time to start to lighten up, 25, 50%, something. On the graph below, notice the 3/6/09 image. Back in March remember how dismal your 401K looked? How horrified you felt over your life savings going down the toilet? Congrats! You didn't sell in the face of a panic sell off. Now is the time to lighten up somewhat. The market is up 38% in 8 weeks! If you had no stocks at all, and bought stocks 8 weeks ago, you would be a fool to not take some profits after such a huge rally, right? No different if trapped in positions at a higher price.
This rally may go another day, 3 weeks, but it won't last 6 weeks. And when this insanity fever breaks, expect the market to go significantly lower.
An interesting note, the short recommendations I blogged about (click here) FELL Wednesday, even though the DOW rallied 101 points. This was true across the board for these stocks.
So gold, food, oil, metals, all up. Great for the resource plays GDX, USL, DXO, AA, RJA, etc. The shorts I discussed down, great. The lottery tickets I recommended are up, MGM over 500% now.
Don't be greedy. Take some off the table. Even if the S&P 500 doesn't hit the 200 DMA, at this point the market has come "Close enough", like playing horse shoes, to count.
Reach out and help a close relative, today.
The S&P 500 is approaching the 200 DMA line, also predicted (Click here). The timeline for this happening is a bit sooner than expected. If your long in stocks, this is a GOLDEN time to start to lighten up, 25, 50%, something. On the graph below, notice the 3/6/09 image. Back in March remember how dismal your 401K looked? How horrified you felt over your life savings going down the toilet? Congrats! You didn't sell in the face of a panic sell off. Now is the time to lighten up somewhat. The market is up 38% in 8 weeks! If you had no stocks at all, and bought stocks 8 weeks ago, you would be a fool to not take some profits after such a huge rally, right? No different if trapped in positions at a higher price.
This rally may go another day, 3 weeks, but it won't last 6 weeks. And when this insanity fever breaks, expect the market to go significantly lower.
An interesting note, the short recommendations I blogged about (click here) FELL Wednesday, even though the DOW rallied 101 points. This was true across the board for these stocks.
So gold, food, oil, metals, all up. Great for the resource plays GDX, USL, DXO, AA, RJA, etc. The shorts I discussed down, great. The lottery tickets I recommended are up, MGM over 500% now.
Don't be greedy. Take some off the table. Even if the S&P 500 doesn't hit the 200 DMA, at this point the market has come "Close enough", like playing horse shoes, to count.
Reach out and help a close relative, today.
 |
| From WebSurfinMurf's Financial Blog |
Wednesday, May 6, 2009
GM is dead...for now.
 |
| From WebSurfinMurf's Financial Blog |
The government has worked with GM and UAW and has reached an approach to bankrupt GM. The estimated effective date will be sometime in June.
The stockholders in effect will be wiped out, getting a fraction of a cent on the dollar. The bold holders who typically get to negotiate with bankruptcy judge on the % they get from the company carcass, typically above 10% (25-50%?).
However in this case, no courts, the government has dictated to bond holders 10 cents on the dollar.
I have already ranted once before how unjust the government is being hard-nosed on GM and UAW while giving banks a free pass. If you care to read my over-the-top rant again for fun, click here.
So today marks a real turning point in America, the "pinnacle" of worker power over the industry, GM and UAW are turning over a new leaf. It remains to see what this looks like after the dust settles.
If your a stock holder of GM, better set your shares to sell at 7:30 am at any price you can get.
If your a bondholder of GM. Sorry to hear that. This includes your pension funds, banks, and 401k fixed income funds.
To read more, check out Karl of Market Ticker, Mish Global Economic Trend, and various news sources.
Tuesday, May 5, 2009
How Far does this bull run? Part Deux
For the last week or so, I have been pontificating on the market turn around that hasn't come. At this point, I am concerned the market will move in a straight line up to penetrate the 200 DMA. I also pontificated (a Happy John stolen pontification) that the market indexes will move back to the 200 DMA. This original pontification was on April 21st, here is is two weeks later with no end in sight to this bull market. Back in April I drew a resistance trend line, at that time I thought that the market would move its way up eventually hitting resistance line in the summer. This still may be the case, but as the market climbs, it maybe in the cards to hit the resistance line sooner.
I said nothing moves in a straight line. Well 8 more days of this and the market will prove me wrong. Also keep in mind next Saturday is options expiration, which historically has played a critical role in market direction change.
Updated chart below.
I said nothing moves in a straight line. Well 8 more days of this and the market will prove me wrong. Also keep in mind next Saturday is options expiration, which historically has played a critical role in market direction change.
Updated chart below.
 |
| From WebSurfinMurf's Financial Blog |
Stock Market Charts
Between the blog reading, CNBC, looking at individual stock charts, talking to other people on their current opinion on market direction, government announcements, and world news, there is just too much information to digest.
I plan to write a series of articles to list out various news sources I try to use. The number one source is my friends opinions, primarily Happy John, and to a far second degree Swan. (FAR second! ;) ). So aside from personal spin, there are other pieces of information I try to read up on. The odd thing is no matter how much I read, I end up with opinions that line up with Happy John. I should just save my time and just always follow him. But its important to do your own research to gain the confidence in your stock plays.
It is pretty hard to look at any single stock or trend to pick when is a good time to get in or out of the market. As a computer guy, I am always looking for the "system" to indicate entry and exit points, for which, there is no fool proof way.
However, many people look at charts of stocks, indexes, and other relative financial data to indicate trends. You have seen on this blog my meager attempt to draw channel lines to back up my reasoning. In general, I don't like the idea of using chart reasoning/analysis as a sole method to the madness, but so many people do so, that it almost becomes self fulfilling, and therefore important.
There are many stock market charting sites. Here are a few I found useful.
Basic Charting
For basic chart look ups, I recommend www.bighcharts.com. Click on advanced, on the left click indicators, then choose SMA - 3 line, and to the right put 50,100,200. Fool around with the other myriad of options to find the view you like. You can save your options for using again in the future.
Another great interactive charting tool is google finance at www.google.com/finance. Google allows you to compare multiple stocks, as well as find news, blogs, and other stocks similiar to the one you are reviewing.
Google finance also as a tool called "stock screener" to help you find a stock to buy or short, based upon a wide variety of customizable characteristics.
Advanced Charting
StockCharts.com is a free site that provides a wide variety of charts, plus has a screener to find charts that match known patterns. This is great to help reduce the number of charts you review by focusing on finding stocks that match the pattern that interests you.
Master Data has a wide variety of free charts featuring ability to add the McClellian Oscilator buy/sell indicator. (Click to read more) I don't really like the format, but there is a wealth of charts and data items you can look up.
TheChartStore.com, a pay site that provides some analysis across the over 5,000 charts dating back to 1840+. The analysis is available if you pay premium service. Some of the charts I particularly like is inflation adjusted charts. I just ordered this pay-site, hopefully I'll be providing some examples in posts to come.
Example charts
From Master data, below you can see two charts of GDX with the McClellian Oscillator, one on a daily chart, the other at a weekly view. The Oscillator when up high indicates overbought, when low indicates oversold. From each time frame, you can clearly see how the Oscillator indicates overbought and over sold conditions. You can also see that the turning point does not have to be sudden, overbought and oversold can last weeks before turning.
From a daily perspective, GDX is oversold and should move higher using this indicator.
I plan to write a series of articles to list out various news sources I try to use. The number one source is my friends opinions, primarily Happy John, and to a far second degree Swan. (FAR second! ;) ). So aside from personal spin, there are other pieces of information I try to read up on. The odd thing is no matter how much I read, I end up with opinions that line up with Happy John. I should just save my time and just always follow him. But its important to do your own research to gain the confidence in your stock plays.
It is pretty hard to look at any single stock or trend to pick when is a good time to get in or out of the market. As a computer guy, I am always looking for the "system" to indicate entry and exit points, for which, there is no fool proof way.
However, many people look at charts of stocks, indexes, and other relative financial data to indicate trends. You have seen on this blog my meager attempt to draw channel lines to back up my reasoning. In general, I don't like the idea of using chart reasoning/analysis as a sole method to the madness, but so many people do so, that it almost becomes self fulfilling, and therefore important.
There are many stock market charting sites. Here are a few I found useful.
Basic Charting
For basic chart look ups, I recommend www.bighcharts.com. Click on advanced, on the left click indicators, then choose SMA - 3 line, and to the right put 50,100,200. Fool around with the other myriad of options to find the view you like. You can save your options for using again in the future.
Another great interactive charting tool is google finance at www.google.com/finance. Google allows you to compare multiple stocks, as well as find news, blogs, and other stocks similiar to the one you are reviewing.
Google finance also as a tool called "stock screener" to help you find a stock to buy or short, based upon a wide variety of customizable characteristics.
Advanced Charting
StockCharts.com is a free site that provides a wide variety of charts, plus has a screener to find charts that match known patterns. This is great to help reduce the number of charts you review by focusing on finding stocks that match the pattern that interests you.
Master Data has a wide variety of free charts featuring ability to add the McClellian Oscilator buy/sell indicator. (Click to read more) I don't really like the format, but there is a wealth of charts and data items you can look up.
TheChartStore.com, a pay site that provides some analysis across the over 5,000 charts dating back to 1840+. The analysis is available if you pay premium service. Some of the charts I particularly like is inflation adjusted charts. I just ordered this pay-site, hopefully I'll be providing some examples in posts to come.
Example charts
From Master data, below you can see two charts of GDX with the McClellian Oscillator, one on a daily chart, the other at a weekly view. The Oscillator when up high indicates overbought, when low indicates oversold. From each time frame, you can clearly see how the Oscillator indicates overbought and over sold conditions. You can also see that the turning point does not have to be sudden, overbought and oversold can last weeks before turning.
From a daily perspective, GDX is oversold and should move higher using this indicator.
 |
| From WebSurfinMurf's Financial Blog |
 |
| From WebSurfinMurf's Financial Blog |
 |
| From WebSurfinMurf's Financial Blog |
300 post
This is my 300th posted Blog article.
Wow, 300......onto 1000!
And in honor of my 300th, let me highlight an AWESOME shorting opportunity.
DIN, 700% up in 7 weeks. Its gone parabolic.

Wow, 300......onto 1000!
And in honor of my 300th, let me highlight an AWESOME shorting opportunity.
DIN, 700% up in 7 weeks. Its gone parabolic.

Monday, May 4, 2009
How much is 100 Million dollars in US budget
Thanks to Steve for showing me this video. It is pretty hard to understand money when its brought to the trillion dollar level. This video shows how much 100 Million is out of the US Budget.
Sunday, May 3, 2009
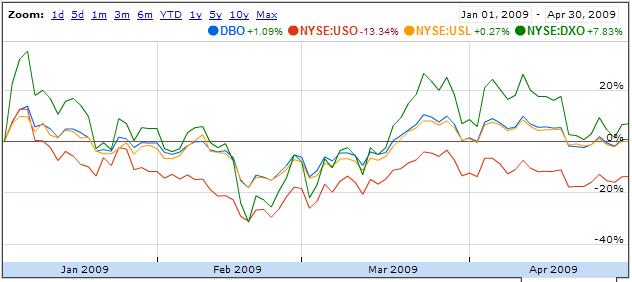
USO vs USL vs DBO
I recently ran across yet another ETF that some push as the best ETF to buy when attempting to profit from the change in oil prices.
So I fired up my Google stock market graph, and loaded USO, USL, and DBO for comparison.
Generally speaking, over almost any period, USO did the worst. The notable exception is during a upward spike of price, USO does best. However, if your trying to get the quick pop, try 2x Oil ETF. DXO. That however also has issues, being Front Runned, along with other leveraged ETF's.
Part of USO's problem is being front runned also, and Alphaville compares it to a quasie ponzi scheme, read on clicking here.
That leaves DBO vs USL. USL purchases the next twelve months of oil future contracts, and continually rolls the current month to 12 months out. I personally like the idea of USL being involved in 12 months of futures contracts, instead of just the "next one", like USO, to help minimized being front runned.
DBO, from what little I found, someone else on the net pontificated "Basically, when the DBO index needs to roll, it looks at the curve at that moment in time, and picks the contract with the least projected annualized roll loss(/most gain). It then runs with this until it needs to roll again."
In any event, historically looking at the stock market graphing, DBO and USL look relatively similiar on the % gain/loss they incur. I added to the graph DXO in the mix for comparison sake.
Click here to look at the Google graph, and adjust the time period yourself. Note that USL started 1/1/08, so don't go before that date.
So I fired up my Google stock market graph, and loaded USO, USL, and DBO for comparison.
Generally speaking, over almost any period, USO did the worst. The notable exception is during a upward spike of price, USO does best. However, if your trying to get the quick pop, try 2x Oil ETF. DXO. That however also has issues, being Front Runned, along with other leveraged ETF's.
Part of USO's problem is being front runned also, and Alphaville compares it to a quasie ponzi scheme, read on clicking here.
That leaves DBO vs USL. USL purchases the next twelve months of oil future contracts, and continually rolls the current month to 12 months out. I personally like the idea of USL being involved in 12 months of futures contracts, instead of just the "next one", like USO, to help minimized being front runned.
DBO, from what little I found, someone else on the net pontificated "Basically, when the DBO index needs to roll, it looks at the curve at that moment in time, and picks the contract with the least projected annualized roll loss(/most gain). It then runs with this until it needs to roll again."
In any event, historically looking at the stock market graphing, DBO and USL look relatively similiar on the % gain/loss they incur. I added to the graph DXO in the mix for comparison sake.
 |
| From WebSurfinMurf's Financial Blog |
Click here to look at the Google graph, and adjust the time period yourself. Note that USL started 1/1/08, so don't go before that date.
Saturday, May 2, 2009
Lottery Tickets 2 months later
Since I am of the belief that the market is topping here, I figured it would be fun to go back and see how the lottery tickets performed, assuming you kept these stocks to the "market top".
I already gave up on most (But not all) of my lottery ticket plays. I cashed out of most, kept AA, and a little of Ford, with a splash of some of the others.
The purchase price comparison is 3/5/09 to 5/3/09. (price COB 5/1/09)
I caught a good chunk of this, but even I bailed on GE very early, LVS/MGM at 200%, DRYS, and most of C. I did keep AA, and plan to keep for year+. Its tough to keep stocks with such good gains to the full run, which I believe is now.
For fun, another comic

I already gave up on most (But not all) of my lottery ticket plays. I cashed out of most, kept AA, and a little of Ford, with a splash of some of the others.
The purchase price comparison is 3/5/09 to 5/3/09. (price COB 5/1/09)
| Stock | 3/5/9 | 5/1/9 | Percent Gain |
| AA | 5.25 | 9.69 | 84.6% |
| F | 1.81 | 5.69 | 214.4% |
| GE | 6.66 | 12.69 | 90.5% |
| LVS | 1.99 | 8.00 | 302% |
| MGM | 1.89 | 7.86 | 315.9% |
| DRYS | 3.54 | 8.28 | 133.9% |
| C | 1.02 | 2.97 | 192.2% |
I caught a good chunk of this, but even I bailed on GE very early, LVS/MGM at 200%, DRYS, and most of C. I did keep AA, and plan to keep for year+. Its tough to keep stocks with such good gains to the full run, which I believe is now.
For fun, another comic
Saturday Video Post 9
Video "stolen" from Market Ticker guy. Writer of book "Dear Mr. Buffett", on US finance. EXCELLENT in depth review of this entire financial meltdown. Well worth the 1 hour watch.
CSPAN Notes on video
CSPAN Notes on video
Friday, May 1, 2009
Second greatest rally in history
 CORRECTION: Click here to READ.
Today marked the second greatest US stock market rally in history! The SPX started at 666 and ran up to 888 today, a total percent gain of about 33% in about 7 weeks!
What was the best % market rally ever? Why 1929! But wait? Wasn't that the year the Great Depression was credited to have started.
BINGO has been called! This is called a BEAR Market rally, and it doesn't last. Could last another two weeks, or its about to go down Friday. But it's not going to last.
Point is, if your caught long from pre-August, be prepared to see some significant % losses from here. Everyone has to make their own decisions, and see my disclaimer on the right, I am an unqualified arm-chair financial pundit.
But if the last time in HISTORY that the stock market gained such a huge percent in such a short period of time was 1929, this isn't good news.....its real bad news.
We may fall, then rally higher, before falling for the final swan dive, and that is still my thesis. But this could be the swan dive about to begin here and now. A swan dive should take us 50% lower from here.
So I urge you, if you regained a bunch of losses, now is a time to take a percent off the table. 25%? 50%? Its your call.
 |
| From WebSurfinMurf's Financial Blog |
I am still holding my gold miners long. In a "panic type" downswing, gold may get a big boost, and take the miners with them. Silver miners look even better, and I may squeeze some money into them long. Added to my shorts Thursday.
Good luck.
Subscribe to:
Posts (Atom)