Welcome new reader!

START HERE, READ THIS FIRST.

Wednesday, January 1, 2020

The year of an explosive market

The Shorter Take

The markets in 2019 did very well, up about 35%!   BUT if you look at August 2018 until today, its up about 12%.  Remember, back in 2018 the market took a hard turn for the last half of that year.

Looking ahead we have two paths ahead, a banner year of gains, perhaps +50% or more, or a market correction.  I am truly torn which one we will see.  The president of the US will press against any fiscal responsibility to keep the market roaring, as he has shown by pressuring the private group, the Federal Reserve Bank.  President Trump stated publicly that we should join in on the reducing of interest rates to negative, to be competitive to the world.  Austria has issued 100 year bonds with NEGATIVE interest rates.   Germany currently pays a negative rate for 1 to 15 year bonds!  Compare that to the USA paying 2.4% for a 30 year bond.

If the USA tries to join in on unconstrained 'free debt', and the world can sustain it, I really do think the market up 50% in 2020 is possible.  S&P 500 from 3250 to 4,875!  

Before I go into greater detail about the economic health, I do what to call out one thing for you to seriously consider.   If you are over the age of 55, and therefore may not have 10-15 years for your savings to return with a market correction-recovery, what is your strategy in investing?   The market has recovered about 480% since 2008, that is very good growth!  That took 10 years to do, but if you where in the market in 2007, you took ~6 years just to stay even assuming you never sold.  

PLEASE take serious consideration of your strategy to withstand a market correction that takes typically 10 years to recover.   RISK only what you can afford to wait even longer to grow your savings.  I drew S&P 500 from 1991 to today to illustrate how amazing the market has been, and yes, can be in 2020.  My opinion is  50% into cash/conservative investments in 2020 is wise after 480% gains if you are 55 or older.  See your professional adviser for whats right for you.


One cautionary factor is to the USA has advanced its debt spending substantially since 2016 with tax cuts.   Our deficit is now at over 1 trillion a year at the HEIGHT of the US economy.  To put that into perspective, if you where paid at 2.7 million an hour 24x7 since the birth of Jesus (year 0) you still wouldn't have enough money to pay 1 year of USA's debt spending!

If we assume the USA and the world will not enter into the one way abyss of racing to the bottom of free debt, lets look at other economic factors that may affect the market.

The question is , if we needed massive tax cuts, QE easing by the banks to get here, what is the government willing to do to keep this party ontrack for the year ahead?

NOTE: I am long the market in the under-valued precious metal sector and Marijuana stocks.
ETF's are GDX, GDXJ, and MJ.

The details

I advise you stop reading here unless you want to understand where I get my view from.

I have gathered items I have found interesting across a variety of sources.   My own thoughts of peak valuation was done in August 2019 post Decade old topping pattern completing.  Although the graphs have advanced, my opinion is the same.


Below is a quote from Hussman Funds, you can read their full post  The Meaning of Valuation .

Yes, interest rates are low, but with them, so are the discount rates and long-term returns that are embedded into current prices. Indeed, the most reliable valuation measures suggest that stock prices are presently about three times the level that would imply future long-term returns close to the historical norm. That may sound like a preposterous assertion, but we’ve seen such extremes before, and they’ve ended quite badly.

Worse, there is a great deal of evidence to support the assertion that interest rates are low because structural economic growth rates are also low. In that kind of environment, a proper discounted cash flow analysis would show that no valuation premium is “justified” by the low interest rates at all. Hiking valuation multiples in response to this situation only adds insult to injury.

Last week, our estimate of prospective 12-year nominal annual total returns on a conventional portfolio mix (invested 60% in the S&P 500, 30% in Treasury bonds, and 10% in Treasury bills) fell to the lowest level in U.S. history, plunging below the level previously set at the peak of the 1929 market bubble. The chart below shows these estimates (blue), along with the actual subsequent 12-year total returns that have followed (red).
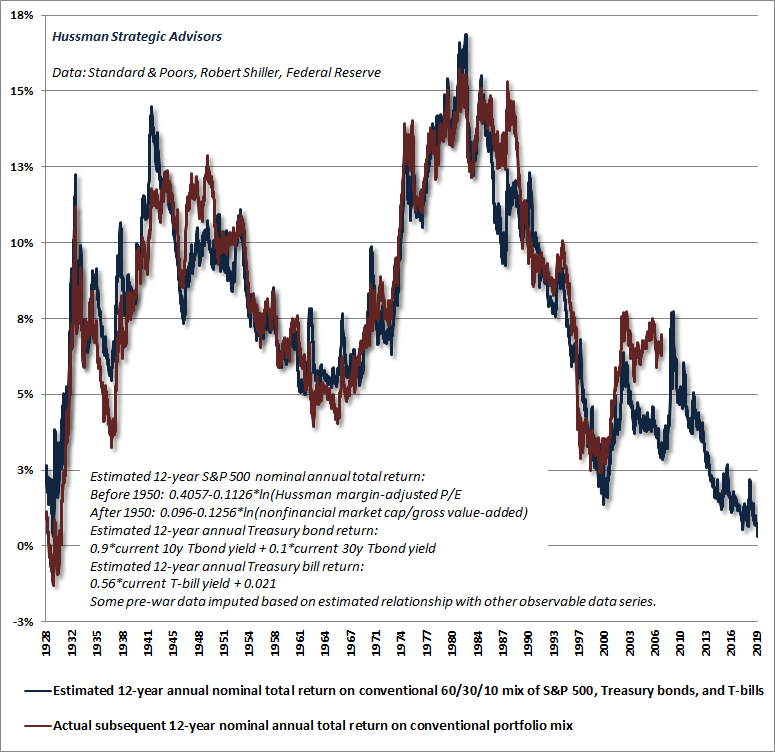
Estimated 12-year returns on a conventional asset mix

Another Hussman post, you can read full here: One Tier and Rubble Down Below

The next chart shows the percentage change in median price/revenue ratios since January 2018. Notice the striking loss of uniformity here. What we see here is essentially a “Nifty Fifty” type of environment, where the most richly valued deciles have accounted for a disproportionate share of the gains while more value-oriented sectors have stagnated or even lost value. This is the hallmark of a market that is losing its engines, yet at the same time maintaining the face of speculation.

We’ve observed precisely the same pattern in the late stages of previous bubbles. Indeed, during much of the tech bubble and the mortgage bubble, value-oriented stocks outperformed other deciles through the bulk of the advance. However, that pattern shifted profoundly as the market approached its peak, with investors increasingly chasing high-valuation “glamour” stocks while the broader market gradually lost its sponsorship.
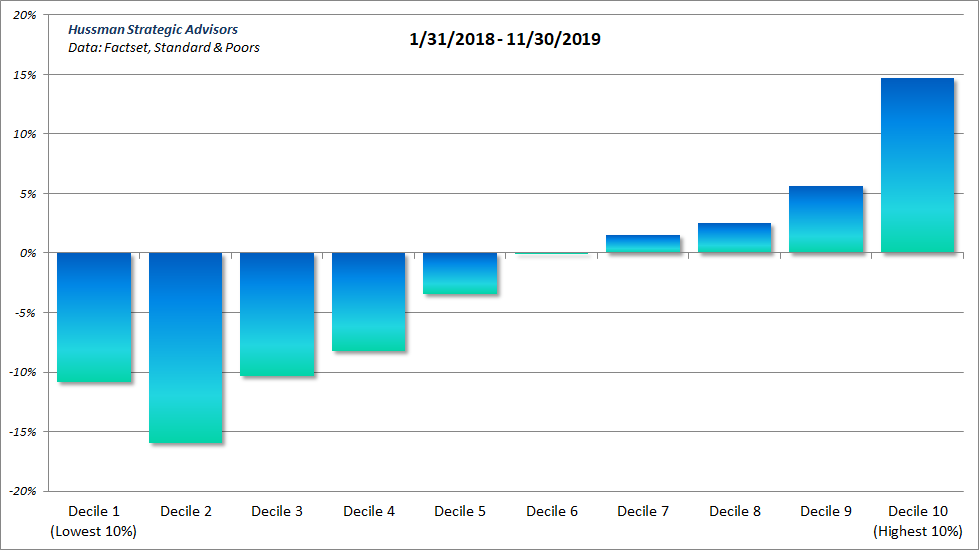
S&P 500 valuation changes by decile: 2018-2019


We are in QE, free money for the financial system!  this goes back to my point, if we continue to support the system with free money, S&P 500 up 50% in 2020 is possible!


Smaller articles, the titles sum up the gist, click through to learn more.

Bills due on vacant chines properties    - ( China  is significantly financially worse than USA )
Capital flight: Money leaving China at record rate  - (If China has its crisis, the world will go with it )

Tuesday, August 6, 2019

Decade old topping pattern completing

I wanted to share some thoughts on the current state of the market.  I will post later reflecting posts from 2016 to today.
All of this is just opinion, for your consideration.  No one knows exactly what next month or year holds.  I want to do my part in sharing my thoughts at this time.  The question should always be risk vs reward vs time you have in life to recover from a downturn.  Downturns can be years to get back to old highs.  (2001-1009 for example)

For interest rates, housing starts, unemployment, gold/bitcoin, and market valuations look at the chart and assess risk/reward yourself.  Consult a professional adviser.

Market Direction Indicator

First is an old indicator of the market direction, read more here.  Looking at weekly moving averages when the 20 SMA and 50 SMA cross, the market is changing direction.  Since 2008, there has been a couple of crosses that have reversed.  Even if you sell, you can buy back on reverse and not miss a significant portion of the market rise.  This helps remove the emotion from market trading and focus on a market direction indicator that historically has been pretty accurate.

The market has NOT crossed down currently.  If you stay in the market, please consider checking this indicator periodically by clicking here and respecting it.


Federal Reserve & The President


The stock market is at an all time high recently, with unemployment at a low.  But two major indicators of issues ahead was recently shared with the world.
First, President Trump was calling for the federal reserve to make major interest rate cuts as early as May.   I assert the president was informed the market outlook is very weak, and he was positioning politically that a market turn is 100% the fed and 0% political policy.  This announcement by the president is what they call in poker a TELL, he is signaling all is not well, are we listening?

The 2016-2019 rally WAS politically caused with cutting taxes to the rich, and enabling international corporations to transfer profits overseas to buy back corporate stock.  The president has claimed the market boom was Trump driven.   And this is key, for what 'easy buttons' are left for the president to pull for another leg up?  And if there is another easy button, why not press it?   I cannot think of an easy button, but then again I didn't expect in January 2016 that politicians would trigger all easy buttons left with a rising market.

Second, the Federal Reserve cut rates last week by a quarter of a point!  With the market at an all time high, the Fed is easing, why?  Again this is a tell, all is not well, are we listening?

This is very dangerous territory, when we mix private (the fed is private banking organization) with politics, historically countries currencies fail.  One can hope the structure of the US organizations can resist this political attack.

Interest Rates

Contrary to popular belief, the federal reserve cannot arbitrarily set federal bond interest rates.  We live in a world with a wide variety of global investment options.  If the Fed raises rates, it can definitely increase purchasing, with a higher rate of return.  If the fed lowers rates, US bonds must be purchased to finance rolling forward debt and 1 trillion dollar a year deficit.  If these bonds are not purchased, rates organically rise to get  buyers.   The recent fed cut in some ways is following, not leading when it comes to US Bonds rates.  If the market can support a lower rate, it is in part an indicator of higher 'safe play' purchases.

Unemployment Rate


Unemployment rate is at an all time low.  Since the fall of 2018, the rate has been influenced by unusual 'seasonal adjustments', I find this troubling.  The question is do we expect rates to go down to 3% or up to 5% as next likely level?  Generic observation seems like mass layoffs are on the rise.  Overall it can't be assessed until later this year with the data compiled.

Housing Starts

Housing starts seems to have peaked a few months back.  Chart for your consideration.  Housing starts are often a reflection of the health of the private sector.

Hedge Fund Commentary


I follow hedge fund manager John Hussman and Jim Chanos.  If you can find a reliable source of latest Jim Chanos thoughts, please post in comments!  Mr. Hussman does post his thoughts on his hedge fund web site.  Recently he gave thoughts about the market topping in post "They're Running Toward the Fire".  Its a good read, I highly recommend it.
Another great article is estimates rate of return of 60 / 30 / 10 of S&P 500 / Treasure Bonds / T-Bills predicted for next 12 years and actual returns.   Spoiler: Current outlook is 3%.
Article "How to Needlessly Produce Inflation"

Gold and Bitcoin


Recently Gold has been on the rise, I assert the new highs since 2012 is an indicator of a trend change in this resource.  While bitcoin I consider a 'collectible', it is along the same lines as Gold, a limited resource that is purchased as an alternate reserve of wealth.  It also is on the rise.
Both of these are 'fear alternate play' indicators.


Bitcoin


Market Charting


Market charting is a questionable methodology of using stock chart analysis to predict future results.  While I don't put 100% faith into this arcane art, it can have effect of influencing professional traders to follow the indicators.  This can make it self-fulfilling.  It also has benefit of zero emotion, just analyze the data.  For these reasons, it is worth considerations.

I follow a market chartist called "The Technical Indicator".  If this is of interest to you, I highly recommend a subscription.   Some of their language in their newsletter is pretty out there, but they do seem to be consistent with chart analysis.

Recently, their indicator has flipped to down for the next year.  The 1-2 year indicator has yet to flip down.


Tuesday, January 8, 2019

Long Term Trading signal 2019

I posted about a long term investor trading signal in 2015 and in 2008.
This post will add current view and refresh on my take on these types of signals.

The signal I have been using is the S&P 500 index Weekly SMA (Simple Moving Average).
This trendline takes the weekly stock market value and averages it over a duration, in this case I use 50 week and 20 week moving averages.

If the 50 week goes higher than the 20 week, this is an indicator of a market trend change down, if the 20 goes above the 50 week, this is an indicator of market trend change up.

Another popular indicator is daily SMA 200,50.  Work on same principal but uses daily instead of weekly moving averages.

These indicators are important to help people try to remove the emotional attachment of their positions to a neutral indicator.   Also there is a herd mentality effect.  Professional traders are aware of these indicators are used and it can become self-fulfilling.

All indicators are not predictions, simply a datapoint to respectfully consider your disposition.
For a more indepth review, please see the original video I watched to learn about this.

Below are weekly and daily SMA for your viewing.
Click these links for current weekly and daily charts.


Sunday, October 21, 2018

Kicking the can on inflation

I recently wrote about rising interest rates ahead, with unpredictable results on world currencies.
People may start to run to variety of wealth preservation schemes as the USD valuation starts to come under assault.   One of those stops will be precious metals / hard assets but this won't last.
The final end game has to be a new paradigm as technology has broken everything else in the wealth storage game.  Some sort of crypto type thing will be the answer, in my 2011 post "Ideal form of Money - Power to the People."


The question is however, why will there be inflation?  We are producing more than ever, at a lower cost, and people simply do not have the disposable income they did 40 years ago.

So if we are under-employed, with lower disposable income, inflation should be impossible!

One of the slight of hands in economic classes is they use 1 word to describe an effect (inflation) and simplify the root cause as one thing.

What we have seen the last 20 years is a variety of efforts to kick the can in rising costs on natural resources.  If we took on renewable energies aggressively, what I am about to describe would be much less of an issue.  However, USA thinks pressing on with solid fuels is the answer, and we will have to learn the hard way.

I wrote previously about peak oil, and how it was real.......until fracking emerged as acceptable.  Fracking did in fact kick that can, NICELY!   But the long term low-cost viability on fracking over a decade is much worse than traditional oil drilling.  The net means we will run through the 'cheap and plentiful' fracking sites quickly.  Once we exhaust the can-kicking option fracking will enable oil to get more expensive per barrel.

More expensive oil will force all costs to rise, and some cost (like shipping) could really accelerate those costs.  But fear not! Before fracking we dreamed up Ethanol as a way to kick the can!  What this gimmick did is set a floor for ALL FOOD must cost MORE than the profit of selling Ethanol as a fuel source.   Which means when oil prices rise, we will plant more Corn to make Ethanol, which will cause other crops to become more expensive as they must be equally profitable as Ethanol!

Unfortunately, in 2018 we are about to unleash yet another reason to force food prices to soar.  Marijuana is threatening to become legal.  Once it does, USA farmers will have yet another crop that maybe more profitable than food, Marijuana.   So food prices must be equal to profit of Ethanol and Marijuana.

Technology is advancing with vertical farming, but that in itself is more expensive than farming.  The good news is it will help put a ceiling (but lagged) on food prices.

Americans will see accelerated costs in food, energy, debt payments (interest rates), and falling house equity.
If only we could have seen this coming back in 2008 financial crisis, the world could have avoided these energy shell games.
Time to get this party started!


Heart of finance just had its first scare in 30 years

I wrote a few times back in January 2009 that the REAL crisis is not the stock market, but risk to Bond interest rates.  Then I wrote post in 2010 "Bonds, Cost of borrowing the heart of all finance" calling out when US 30 year bonds interest rates go above 30 year downtrend, we will enter a new world not since the 1970's, a rising cost to borrow.

Well, we finally broke this recently, as graph below shows:


Our economic model is based on debt, and for 30 years businesses and people could borrow and expect LOWER payments 2, 10, 20 years later.  In 2018, this expectation has shifted to higher rates for decades ahead.

I expect in the year ahead a new world financial crisis to start to emerge, as the debt based society can no longer 'roll debt forward' with lower costs.   I also expect FINALLY the Precious metal sector to get a boost, now that bitcoin has taken it on the chin.   I do expect however when precious metals soar, when they break, the action for rest of my life will be in the cryptocurrencies.   I do think precious metals have one more act in them before being retired from the global economy as nothing more than expensive rocks.

I expect USD valuation is where it will get strange, as our global economy has always judged health of fiat currency against other fiat currencies.    If I am right about interest rates, and fiat currencies are the main value store for next 30 years, then I would expect USD to keep rising and rates must rise to 'break the fever" of USD trading higher, like Volcker DOUBLED US interest rates overnight in March 1980 from 10% to 20%, producing the extreme graphs above and below.

Imagine today, with so many Americans citizens and companies rolling forward debt dependant on the kindness of 30 years of lower rates experiencing such a spike in rates!
.


I am making NO predictions except one, what the world knows as the 'right and wrong' things to do in the financial markets since 1982 is out the window.   Companies that have been stable for decades may wake up in deep trouble in the year or two ahead.   While we can have issues sooner, I expect this party to get start really cooking in the year 2020, USA next presidential election.

In the near term, I am watching a 2 year and a long term indicator for the world markets to enter a bear market.   Things look like a double top and we are about to hear the Bear roar.  But until the charting has confirmation, act with caution for a Bull or a Bear.  The 2 year indicator will mature October 31st, so clarity should come in late 2018.

See NEW related post on inflation.

Good luck!
Keep eye on GDX, GDXJ, and new markets such as 'Alternative Crop' stocks!

Monday, September 17, 2018

Market Rumblings

Below is a snippet from the weekend report of " https://www.technicalindicatorindex.com/ "
Consider a subscription for yourself.

Here is what they had to say.

The Bottom Line from Today’s Market Action: Something is up. Something big is coming. We cannot be sure precisely when or what, but there are warnings from the technical indicators and patterns from the market this weekend that tell us the stock market is in an extremely dangerous place. Caution is warranted. 

We look for the Plunge Protection Team to be active at this time. Whether they succeed or not is to be determined. Stocks were flat Friday, September 14th. The stock market generated its 11th Hindenburg Omen observation Friday for the official H.O. from August, and has now triggered 9 H.O. observations in consecutive days. This has not happened in the past 40 years we have tracked Hindenburg Omens. This tells us the market is in an extreme unhealthy condition, is fragile, and could plunge given a trigger event. 

This does not mean a plunge is coming for certain, however every stock market crash (declines greater than 15 percent) over the past 40 years have been preceded by a Hindenburg Omen. There are large and growing Bearish divergences evident this weekend between the major U.S. stock averages and their 10 day average Advance/Decline Line Indicators, their Demand Power measures, and there is a Bearish divergence between the S&P 500 and our intermediate term Secondary Trend Indicator. 

Rising Bearish Wedge patterns are completing in the major averages. Downside price targets suggest a plunge will follow. We show charts for all of these patterns in this report. 

Friday, September 7, 2018

Bear Market waking up

I put a panic alert out in March, then went positive in May.

Today unemployment numbers was released.  The headline shows 'steady as it goes', about same as past, 200K positive job growth.  But like most things, the details is in the 'fake news'.  The unemployment shows over 2 million people dropped out of the labor force for this report.  The assertion is 2 million people retired or gave up looking for work since the last unemployment report.  Considering currently we have only 58% of the population 'employable', we lost 1.5% of the work force this period.   The recorded job loss was 1.46 million jobs.  When you have 2 million drop out of the work force, we have a NET positive job growth.

If you believe above is fake news please stop reading.  If there is pause for concern, read on.

Being generous and using seasonally adjusted numbers this is the WORST report since January of 1999 , with 423,000 jobs lost.

Combine this with the trade wars starting, and the indicators I follow show a potential market trend change below.

I am putting on the caution warning for the markets, with unconfirmed price action for this being the next new recession starting.

I cut my investments by 40% today.

What makes me very concerned is interest rates are still VERY low, and with corporate tax cuts corporations pulled their cash from over-seas in record amounts with executives dumping shares.  If there is a downturn in the market, I have a hard time seeing what is the easy stimulus plan.


Wednesday, May 16, 2018

Positive outlook

Back in January, the trend indicator went negative first time in a while.  The indicators have been flip flopping ever since.  On May 11th, all trend indicators are pointing up!   The next expected challenge to this trend  is in August-September, about then the 1 year indicator anniversary is up, and closing in on the 2 year trend indicator.

It is possible to change sooner, if we do, that will be called a failed cycle, and it will be much more dramatic than January if that was to occur.  Swing back here in August for an update, or sooner if we have a failed cycle.
I may not be diligent on updating when this trend changes, so consider subscribing to the service yourself.  

Good Luck!


Friday, March 2, 2018

Market Direction Change

I been emailing friends on the market since Feb 2nd, the upshot is we likely formed a top for the next 3 months, and very possibly a year out.  Unfortunately the year out part isn't clear yet.

I subscribe to two services, https://chartfreak.com/, which focuses on individual stocks and https://www.technicalindicatorindex.com/ , which covers macro trends of the market.

the screenshots below are from them, its a paid service, so I don't share the information except when I see extreme moments in time like we may be in now.

The ultimate confirmation will be when this indicator flips
http://websurfinmurf.blogspot.com/2015/10/long-term-investment-trading-signal.html
Food for thought on Market fall predictions using Fed Funds Rate
https://www.themaven.net/mishtalk/economics/chart-predicts-every-market-crash-in-history-ZQD5lS5qnEa6x0Yf0_UGWw


So lets recap!


Feb 2nd

Friends,
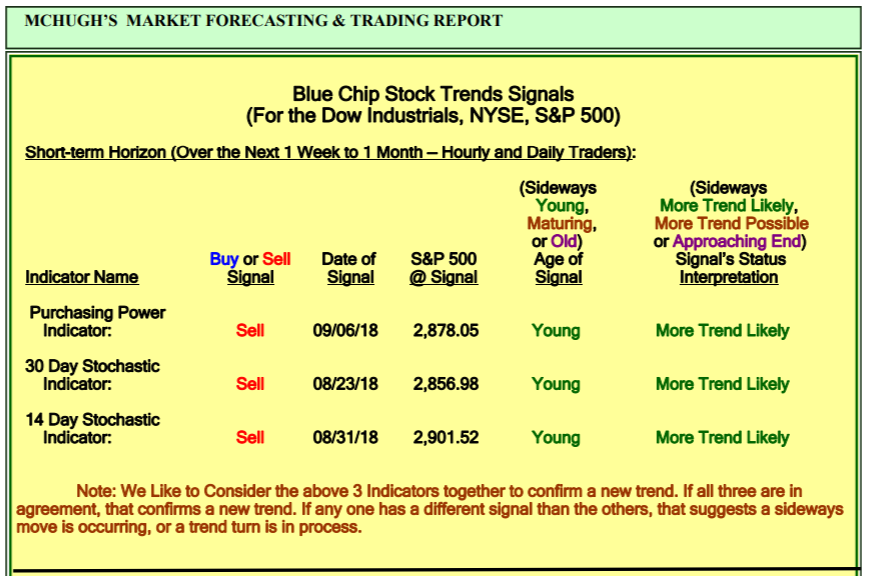
I subscribe to a market analyst that generated indicators of a down market for next 14 days, 30 days, and potentially for months.
Please see below the summary.

Unfortunately for me, I didn't check this earlier, I would have exited on 31st.

I'll keep SOME shares of most positions as a "reminder" of my exit position, and to watch in event this trend changes to re-establish.
Also for some precious metal miners I may keep a higher percent.

So while I am not panicking, I am taking serious this new sell signal after a parabolic run up.
Inline image 1

Feb 11th

Friends,

The same indicators indicating Jan 30th time to exit the market, is now showing a counter-rally starting Monday.
Their prediction is we fail around the previous high (just short, or somewhat higher), then resume downtrend.


So if you wanted in, or didnt get out, we had a healthy sell off that may provide some cover for getting into or out of the market.
Unless I email otherwise, assume sentiment is ultimate failure for a confirmed  bear market to begin.  Could be a couple of weeks or later this year before the down trend breaks below here.

As for me, I will keep it short-term trading, no big position long-term holds.

Good Luck!
March 1st
Market is looking weak, the counter-rally from the initial drop may be over.

One more signal to trip to confirm reversal to next leg lower


March 2nd

Confirmation today.

I won't bother updating anyone again until I see the Purchasing Power/30 day/14 day/ and 1-3 month turn green.
My main concern was the parabolic swing up we would see would burst, and it did late January.
The counter-rally was a great time to get out or take a chance of this thing turning around.

At this point, unless I see all green, I am assuming we saw a 1+ year top.
Good luck!

Monday, January 1, 2018

2018 New Year - Looking Behind and Ahead

I wanted to take a moment to post some thoughts.
Looking across the economic board, we are in for another banner year in 2018, there is nothing holding the market back, the sky is the limit!
Honestly, I can't post any reason why we dont just double from here.  And thats the issue, when a 'critic' can't show you why we can't retreat chances are, something is a foot.

There is one issue, and I posted this back in 2010, and that is interest rates.

Yes! boring old interest rates, who cares when we have so many places to invest!
The issue is the world monetary system is built upon a debt-system, and when rates go up, we can have issues.

Further, with the new tax cuts and technology advances, I expect more gaps in the poor vs wealthy in America.  the middle class has been beaten, kicked, and next routed.  Maybe with our current president the populous will accept the new reality over the next 3 years.  It could be as simple as having the 'right communicator' in charge to push the haves into the next level of wealth.

So lets take a look, first at my concerns, then the rest.  Really, its hard to see anything of real concern at all.

First up is long term stock indicator I have posted, the overall stock market is set to GREEN!
If the lines cross, time to be cautious.

How about interest rates?  when the lines cross, time to get concerned.


Next up is US Debt.  While Debt isn't NEARLY as bad as media an politicians make it to be, it can become an issue if the work perception turns on USA.  Notice the Bush crash ballooned the debt to 75% before Obama and Obama took 2 more years before the debt jumping slowed.

Clinton debt went down, all others up!

Since Debt really isnt a forefront issue, lets move to one that is, Energy.
If USA charges ahead to reduce dependence on Oil, this won't be as big a deal, but current administration may be hellbent on keeping America dependant on Oil.
And currently, even if the administration wants to get off Oil, we are far from it, so Oil price must be under control.

Bitcoin is all the rage, and I am playing with MGTI (bitcoin stock) and Marijuana stocks.
How is my old axe I grind since 2009, gold miners?  Really hate these things, but there seems to be some life ahead.

Then there is a few of the other sectors to look at.


So there ya have it.  Sky is the limit, all is great until it isn't.  I like Marijuana stocks and bitcoin stocks/  Keeping an eye on interest rates, food costs, Oil costs, USD value, and China's health.  If china breaks out of the trend line upwards, we should have a nice ride.

Wednesday, September 6, 2017

USD, Gold, Blockchain, Jobless claims, and the future

It has been almost a year since I last posted, and much has happened.
We have a new president!
The USD valuation rocketed high, and since January 2017 had an epic fall!
Bitcoin  rocketed from $500 a coin to $5,000.
US Stock market hit new highs!

Exec summary
I go into detail on charts/info below.
The upshot is US Stock markets are flat for the year relative to USD currency.
Gold is rising, Oil looks to have bottomed, Interest rates are pressing to break trend lines to up side.
GDX (gold miners) about positioned to to have fast rising trend change!
Jobless claims at a low since the 70's.
Looking ahead, investing in some cryptocurrency companies, (MGTI ?) Gold miners (GDX On the rise!)  Hedge against interest rate changes ahead, and using the hurricanes to explain a 'trigger' in a recession in 2017.  Reality is we had an expansion that latest quite a while, and the economy does shift at extremes.

Good luck!


Detail
I'll throw some charts on the blog with a sentence of potential trends......
All valuation are RELATIVE to the USD which is relative to other currencies.
So if the USD is cut by 10%, and the stock market went up 10%, to a person from a different country and their valuation, it would not move to their valuation.  Example:
Put in $10K of Euro into US stock market, and if USD to Euro became worth $9K, but if the market went in USD from $10K to $11k (USD) then to the Euro holder it would be worth 10,000 Euro, converted back to Euro same as it went in.
$11k USD * 90% conversion adjustment = 10,000 Euro

This "relative" value causes people inside that value system to mis-understand when things are going up or down, how that is relative to the world.
These charts needs to look at relative to outside USA.  To the charts!

USD went from 103 to almost 92, that is about a 10% drop according to "International Exchange rate"
Lets take a look at the Stock Market!


Over the same period the S&P 500 went up about 10%!
So the current market new highs are not a new high at all relative to outside USD currencies but flat for the year!

Lets take a look at other USD  'independent' valuations, like oil.  It has gone DOWN 10% for the year relative to USD.  Thats pretty good!


Onto Gold...how does it fare?
This chart shows gold valuation , blue line, left axis, vs USD valuation, orange line, right axis.
The USD valuation is 'broad set of currencies' and is not international exchange rate.  so a difference in the drop of 10%.
Gold went from 1140 to almost 1300, gain of  14%
USD 128.5 down to 118.5, a 7.8% drop.


GDX - Gold miners


Interest rates -

1 year and 10 year bond rates.  1 year is a trend change, interest rates are rising!  10 year is pushing on the down trend since the 80's, not good.


This next one has SOME relative valuation to it.  It is the 'debt' the USA carries relative to GDP.
The most meaningful part of this is that other countries do look at this as an indicator.
Japan's debt to GDP is 250%, so the USA chart I question its value.  I think it means more when people want to make it a perception point to focus on, as the republicans did under Clinton and Obama.

Economy charts

Initial Jobless claims, lowest since 70's!


Thursday, October 13, 2016

Gold Miners - What next?

As a refresher, I put quite a bit of emphasis on a tried and true long term stock purchasing guide that is described in post "Long Term Investment Trading signal".

Gold miners after CRUSHINGLY punished for years I believe hit a bottom in January 2016 for years to come.

Since then miners exploded up over 250% from low to high this year, and recently had a tear-your-face-off pullback.  Does that mean gold miners are dead? Hardly.

Lets take a look shall we?

Notice the weekly SMA is still on the upswing, and the downswing for GDX has held above the 50 weekly SMA.  This was a brutal, but normal pullback.

What stocks to consider? Depends on your risk-to-reward.
Lets assume GDX hits 35 by march...

GDX/GDXJ - lower risk, ETF across miners (major/minor)  Profit ~50%

Call options on GDX for far out, I purchased 20 GDX calls for March 2017 strike 23.
Risk: very high, options can go worthless.  but if GDX hits 35 by then, will be a 500% profit.

Another way to get higher % with somewhat less risk than stock options is buy stock in the sector that is cheap and therefore potential higher % returns
TGD - 0.48 a share, was $3 in 2013
NAK - 0.60 a share, was $12 in 2008 & 2011.
GSS - 0.78 a share, was $4.50 quite a bit between 2004-2011

some that have already run...maybe more
HMY in september 2015 was 0.82, now $3
AU in september 2015 was 6.60. now 13.70
AGI in september 2015 was 4.50, now 7.70
There are quite a few runners if you look.
My hope is this next push up, those that did not run up before will now.
Good luck