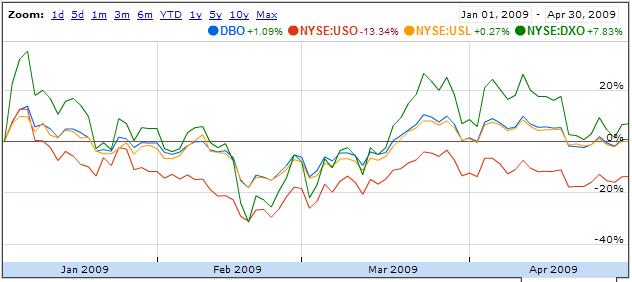
So I fired up my Google stock market graph, and loaded USO, USL, and DBO for comparison.
Generally speaking, over almost any period, USO did the worst. The notable exception is during a upward spike of price, USO does best. However, if your trying to get the quick pop, try 2x Oil ETF. DXO. That however also has issues, being Front Runned, along with other leveraged ETF's.
Part of USO's problem is being front runned also, and Alphaville compares it to a quasie ponzi scheme, read on clicking here.
That leaves DBO vs USL. USL purchases the next twelve months of oil future contracts, and continually rolls the current month to 12 months out. I personally like the idea of USL being involved in 12 months of futures contracts, instead of just the "next one", like USO, to help minimized being front runned.
DBO, from what little I found, someone else on the net pontificated "Basically, when the DBO index needs to roll, it looks at the curve at that moment in time, and picks the contract with the least projected annualized roll loss(/most gain). It then runs with this until it needs to roll again."
In any event, historically looking at the stock market graphing, DBO and USL look relatively similiar on the % gain/loss they incur. I added to the graph DXO in the mix for comparison sake.
 |
| From WebSurfinMurf's Financial Blog |
Click here to look at the Google graph, and adjust the time period yourself. Note that USL started 1/1/08, so don't go before that date.
No comments:
Post a Comment