The stock markets have climbed higher today, but on low volumes. Two of the services I subscribe to, which I highly recommend, is The Elliot Wave International Financial Forecast & Gary of the Smart Money Tracker. What I find fascinating is two different respected market technicians I follow, Elliot Wave and Gary of the Smart Money Tracker have significant contradictions on the next market move. Gary in a recent post pretty much called charting ignorable, since the market will follow it's own trajectory. EWI has quite a lot to say about the current market retrace using charts.
For me, charting isn't a predictor (aka Gary), but it does serve to illustrate extreme situations, which puts context in historical, and therefore probability. But for anyone who has been burned at the Casino knows, the most improbable can happen when least expected.
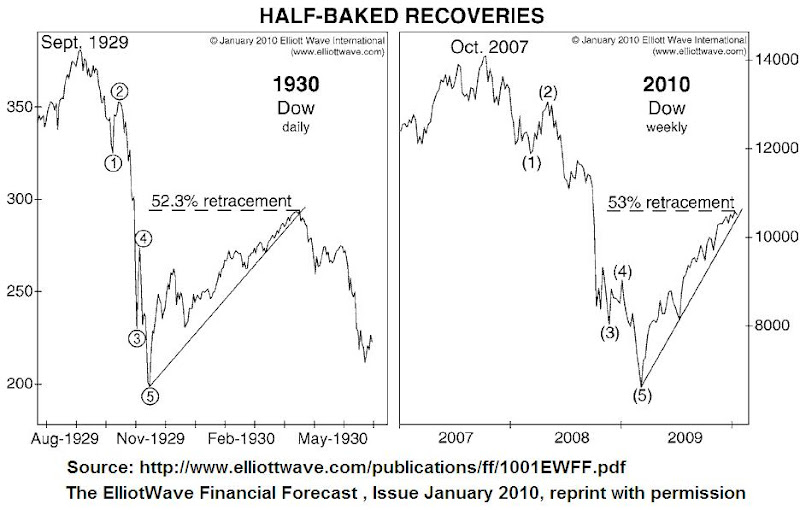
This months Elliot Wave International issue of the Financial Forecast (Jan 2010) has much to say, Two charts I asked for reprint permission for my blog, and are presented below. I do believe has impact as it tells a startling story. The first graph compared the start of the Great Depression where the US stock market retraced 52.3% before its multi-year decline. The US stock market is over 53% retraced, surpassing the Great Depression rebound. That alone should be a warning sign that things are not normal.
But as Mish's Global Economic Trend Analysis points out, the more recent event of Japan shows it's stock market retraced 140% from it's low before it resumed its 2 decade devaluation which continues even today. As Karl of the Market Ticker points out, Japan is considering such drastic measures as to put the currency at risk, and by the Japanese central bank continuing to promote its 2 decade failed (and wrong headed) battle to turn the economy around through fiscal games. If anything Japan illustrates what the US will probably do, repeat the wrong headed policies until the implosion of the US dollar. Hopefully Japan beats the US to it, and the US wises up from that event.
But I digress. The important point is even with a failed economic policy, counter rallies can extend farther than anyone would expect.
Another chart from Elliot Wave shows in context from the .com bubble and now, illustrating events that mark a likely market top. This includes glorifying the Fed chairmen who brought the US financial disasters to our doorstep in the first place, investor confidence at all-time highs, these are all typically contrarian indicators.
So while all indicators are pointing to a massively over-valued US market, Japan shows we could have a long ways to go, as per Gary. Elliot wave is trying to pick the top, which I have personally experienced is a fools hobby. In any event, all of this should tell you, we are in abnormal times, and ensure you pick your pain points to change investments.
 |
| From WebSufinMurfs FinancialBlog2 |
 |
| From WebSufinMurfs FinancialBlog2 |
This comment has been removed by a blog administrator.
ReplyDelete